
On May 11, 2016, under the directive of the National Energy Administration (NEA)'s Science and Technology Equipment Division, China Energy Storage Alliance (CNESA) and Messe Dusseldorf (Shanghai) held the two day Energy Storage China Summit 2016 and Energy Storage and MicrogridTechnology Expo at the Beijing International Conference Center. The conference was built around the 'Energy Storage and the Energy Transformation - Supporting China's Energy Reform', with a Plenary Session, three forums and four seminars, hosting over 1000 industry participants, 80 experts, and 50 companies came to the event.
On Day 1, CNESA launched its Energy Storage Industry White Paper 2016, giving an overview of the 2015 global energy storage market and forecasting China's ES market, which is to reach 24.2 GW by 2020 in the ideal case, and 14.5 GW in the business-as-usual case (both figures exclude pumped hydro).
1. Global Energy Storage Market Development Status
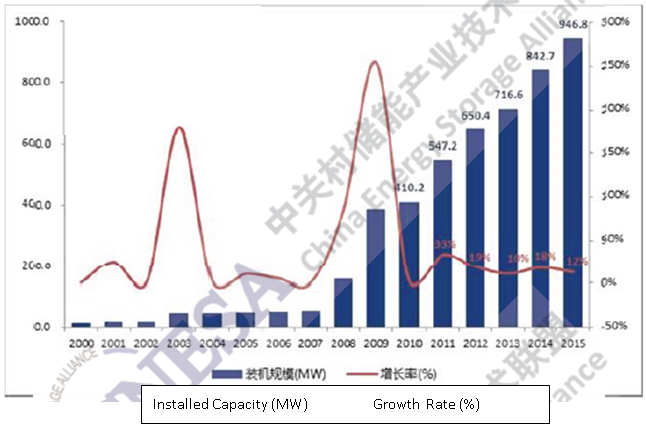
Global ES Market: 946.8 MW Capacity and strong growth trends
As of Dec 31, 2015, There were 327 ES projects in operation (excluding pumped hydro and CAES (compressed air ES), and thermal storage), totaling 946.8 MW, with CAGRs (compound annual growth rate) of 18% for installed capacity and 40% for number projects from 2010 to 2015 (5 years).

Figure 1: Global energy storage market cumulative installed capacity (2000-2015)
Geographically, the US remains the leader, with 426.4 MW of ES in operation as of the end of 2015, having surpassed Japan in 2014. Japan and China follow, making up 33% and 11% of global installed capacity, respectively. Europe has shown the fastest growth rate over the last 2 years (2013-2015) with a CAGR of 115%.

Figure 2: Geographic distribution of operational ES projects (cumulative) (2000-2015)

Figure 3: Global ES project distribution 2000-2015
Technologically, lithium ion batteries are the clear leader in cumulative operational projects and projects under planning/construction, with 356.7 MW in operation and 2.2 GW under planning and construction. With six times as many projects under planning/construction, in the next 2-3 years, installed capacity of li-ion batteries will see explosive growth.
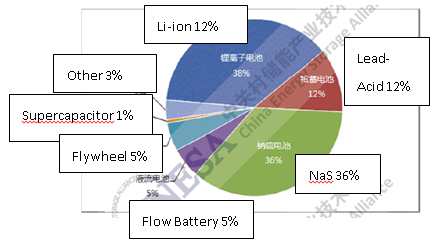
Figure 4: Geographic distribution of operational ES Projects

Figure 5: Geographic distribution of operational and under construction/planning ES project
In terms of function, renewables integration was the largest field with 43% of total installed ES capacity, with frequency regulation exhibiting the fastest two-year growth at 31% CAGR (2013-2015), and distributed generation and microgrids making up the largest number of projects - 60%.

Figure 6: Operational ES project applications share by % total installed capacity and % number of projects
In the supply chain, in 2015 there were 44 ES technology manufactures, 12 PCS companies, and 34 integrators that installed ES projects (including commissioned, under construction, and projects in planning). These companies were based in 10 countries, covering 9 types of ES technology. Of the top 10 manufacturers, 7 were Asian (mostly Japan and Korea) and holding the top 5 spots, with BYD being the only Chinese manufacturer in the global top 10.

Figure 7 ES manufacturers by country (2015)

Figure 8 Top 10 ES manufacturers by installed capacity
For investment, as of end of 2015, 17 companies received investment or sold bonds, etc, completing financing or were acquired, totaling US$1.02B, up 155% from the previous year. The 5 companies with the most financial/investment activity were Main Street Power (US$250M), Energizing (US$250M), SolarCity (US$100M), Sakti3 (US$90M), and Stem (US$84M).
For government financial support, as of the end of 2015, US$2.04B had been allocated by government bodies to support all types of ES-related projects. The US provided the most support, with many institutions allocating funds and supporting the widest range of projects. Two federal institutions and 5 state government institutions provided funds totaling $1.28B.
2. China’s Energy Storage Market Status
China: 105.5 MW of installed ES, and is turning the corner for growth
As of end 2015, China had 118 ES projects in operation (excluding pumped hydro, CAES, and thermal), totaling 105.5 MW and making up 11% of the global market, and has been growing at a CAGR of 110% (2010-2015), over 6x the global rate.

Figure 9: China cumulative installed ES (2000-2015)
Technologically, of projects in operation, lithium ion, lead acid, and flow batteries are the major technologies, with Li-ion making up 2/3 of the market.

Figure 10: China ES projects in operation by technology (2000-2015)
Distributed generation and microgrids and renewables integration are the major application sectors, making up over 80% of China’s installed ES market (by both capacity and number of projects). Distributed generation and microgrids alone make up 56% of China’s installed ES capacity and 77% of installed ES projects.
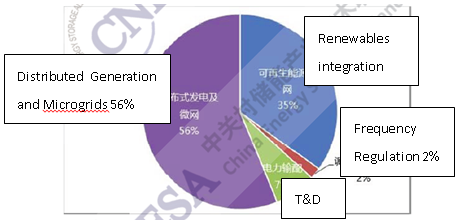
Figure 11 Application distribution of operating ES in China by capacity (% of operating MW)

Figure 12 Application distribution of operating ES in China by number of projects (% of projects)
f the top ten manufacturers, most are lithium ion battery makers, with BYD being both China’s leading ES manufacturer and lithium ion battery maker. Dalian Rongke is China’s largest flow battery maker, and Southern Power is China’s largest lead acid battery maker.

Figure 13 China’s top 10 ES manufacturers by installed project