User-side Energy Storage Installation Declines Month-on-Month, Return on Investment Faces Increasing Uncertainty
Source: CNESA
Latest Data on User-Side Energy Storage Released: Year-on-Year Growth, Month-on-Month Decline
According to the latest CNESA DataLink statistics, user-side energy storage installations in September recorded year-on-year growth but a month-on-month decline. However, registration data shows that both the installed capacity and the number of new user-side storage projects exceeded the same period last year — up 28% and 80% year-on-year, respectively — indicating a clearer market structure emerging for user-side energy storage.
The report reveals that over 70% of installations came from high-energy-consuming industries, such as metallurgy, chemicals, and textiles, where “carbon reduction and power security” have become essential demands. In parts of Guangdong Province, the peak-to-valley electricity price gap remains around RMB 1.0/kWh, allowing for more than 600 charge/discharge cycles per year, offering strong potential for energy arbitrage. This correlates with the province’s filing data, which shows a 359% year-on-year increase in registered energy capacity. However, frequent adjustments to time-of-use (TOU) electricity pricing policies have also introduced greater uncertainty in investment returns.
September Analysis of User-Side Energy Storage Projects
According to incomplete statistics from the CNESA DataLink Global Energy Storage Database, in September 2025, newly installed user-side energy storage capacity reached 243.56 MW / 488.22 MWh, representing a year-on-year increase of 38% and 18%, but a month-on-month decline of 41% and 46%, respectively.The newly commissioned user-side energy storage projects in September exhibited the following characteristics:
Application: Over 70% of installations came from high-energy-consuming enterprises
The industrial and commercial sector dominated the market, making up more than 95% of total new capacity — 236.86 MW / 479.66 MWh, a year-on-year increase of 37% and 19%.
Projects owned by enterprises in the metallurgy, chemical, and textile industries represented 73% of newly installed capacity, indicating that carbon reduction and energy reliability needs have become major drivers of user-side energy storage adoption.Technology:
All new operational projects adopted electrochemical energy storage technologies, with lithium iron phosphate (LFP) batteries accounting for 99.96% of total power capacity.
In terms of non-lithium technologies, a 90 kW / 180 kWh sodium-ion battery storage system for an industrial and commercial user was also completed and put into operation.
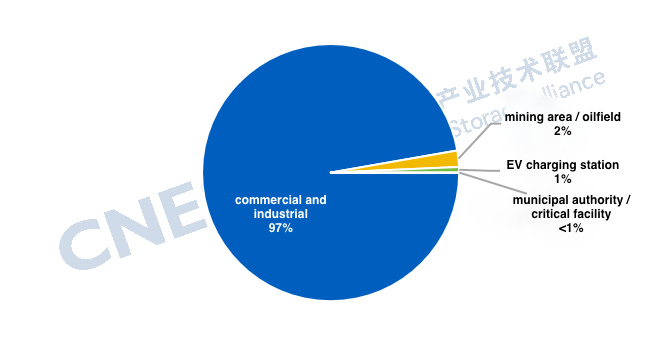
Figure 1. Application Distribution of Newly Commissioned User-Side Energy Storage Projects in September 2025 (MW%)
Source: CNESA DataLink Global Energy Storage Database — https://www.esresearch.com.cn/
Note: “Commercial and Industrial” includes industrial parks and commercial buildings.
New installations: Jiangsu had the largest capacity, while Zhejiang recorded the most projects
From a regional perspective, newly commissioned projects in September were mainly concentrated across 15 provinces, including Jiangsu, Zhejiang, Jiangxi, Henan, and Sichuan.
The East China region dominated the month’s new installations, accounting for 71% of total capacity and 43% of total project count, ranking first nationwide in both metrics.
At the provincial level, Jiangsu recorded the largest new installed capacity, representing nearly half of the national total, followed by Zhejiang, which led the country in the number of newly commissioned projects, accounting for over 20% of all projects.
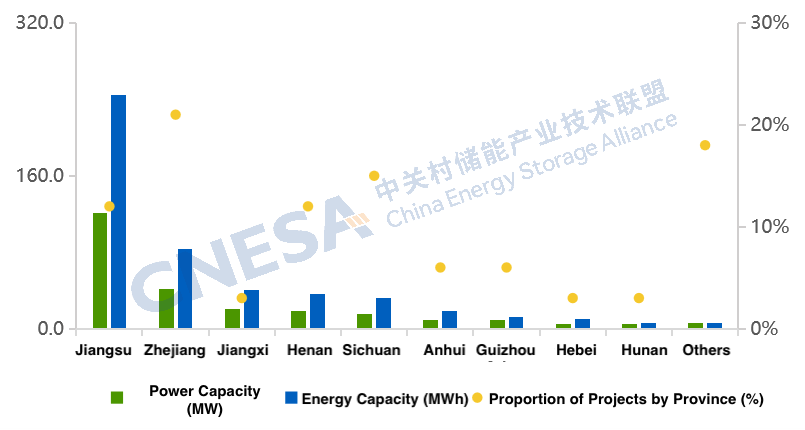
Figure 2. Provincial Distribution of Newly Commissioned User-Side Energy Storage Projects in China, September 2025
Source: CNESA DataLink Global Energy Storage Database — https://www.esresearch.com.cn/
New filings: Zhejiang, Guangdong, and Jiangsu saw a 9% year-on-year decline, while Anhui, Henan, and Sichuan recorded a 150% increase
According to project filing data, both the total capacity and the number of newly registered user-side energy storage projects in September exceeded those of the same period last year — up 28% and 80% year-on-year, respectively.
In Zhejiang, Guangdong, and Jiangsu, over 740 new user-side storage projects were registered, representing a 9% year-on-year decline in project count but a 68% increase in total capacity. Among them, Zhejiang recorded the highest number of new filings, with capacity rising 80% year-on-year and 144% month-on-month. Guangdong saw growth in both capacity and project count, up 359% and 25% year-on-year, respectively. Jiangsu had the largest total registered capacity, up 38% year-on-year, though its project count dropped 32%, indicating a clear trend toward larger-scale single projects.
Beyond these leading regions, Anhui, Henan, and Sichuan each registered over 80 projects, totaling more than 380 combined, marking a 150% year-on-year increase — signaling their emergence as new growth markets for user-side energy storage.
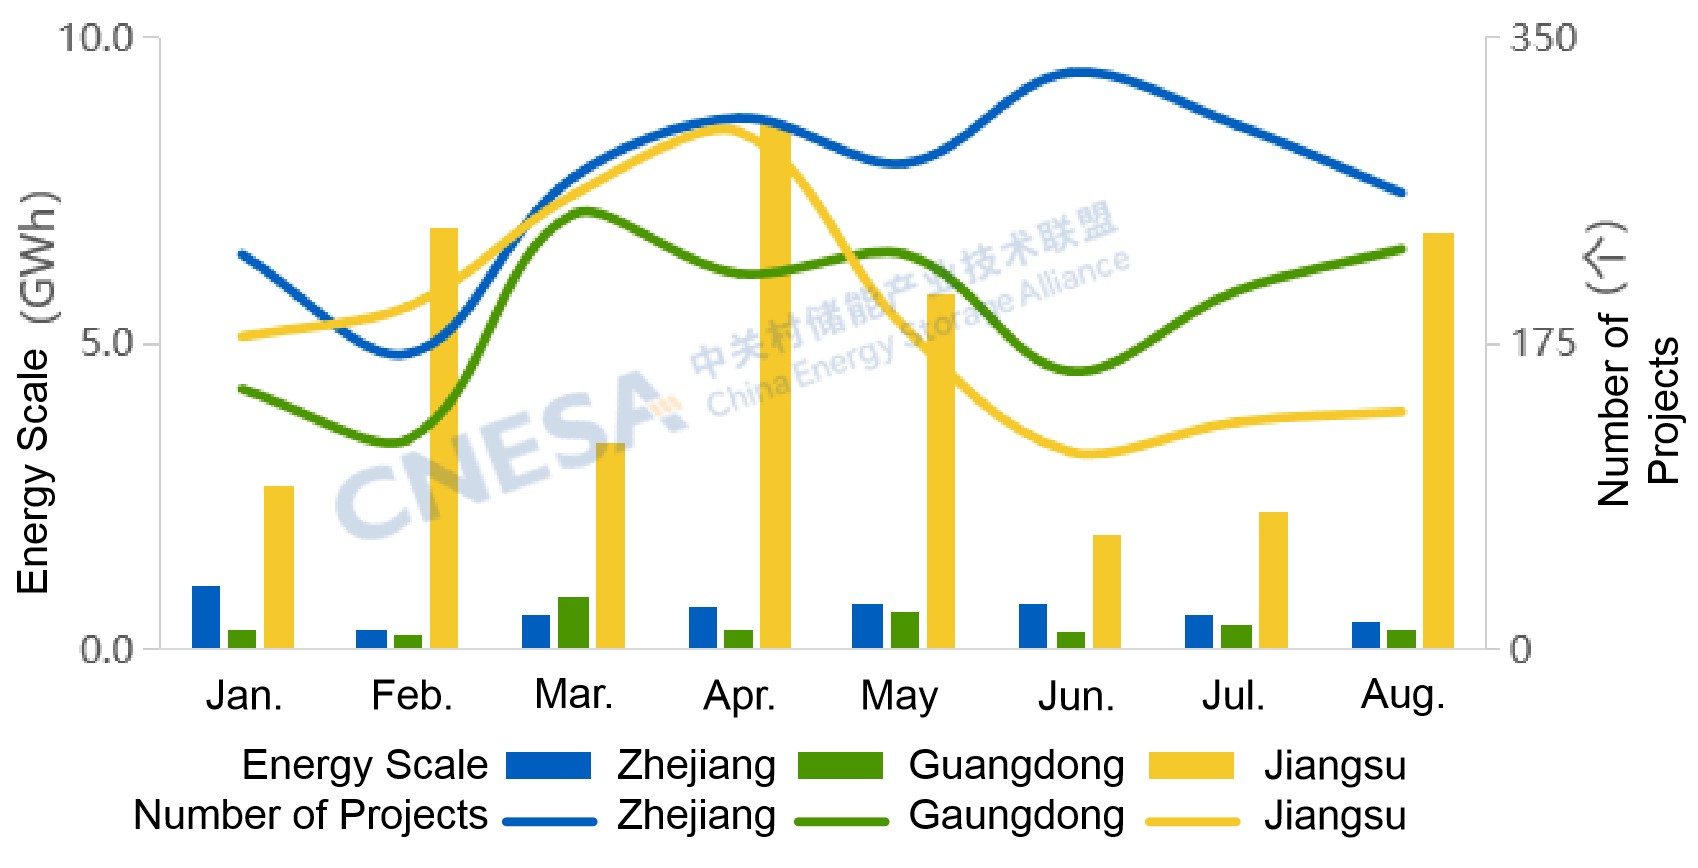
Figure 3. Monthly Distribution of Newly Registered Energy Storage Projects in Zhejiang, Guangdong, and Jiangsu (January–September 2025)
Source: CNESA DataLink Global Energy Storage Database — https://www.esresearch.com.cn/
Peak–valley price gap: In some parts of Guangdong, the gap continues to remain above 1.0 CNY/kWh
From the perspective of the maximum peak–valley price gap, 15 provinces and cities have a difference exceeding 0.7 CNY/kWh, and 7 of them exceed 1 CNY/kWh. Guangdong maintains the largest gap, with areas such as the Pearl River Delta’s five cities, Jiangmen, and Huizhou continuing to record a maximum gap of over 1.0 CNY/kWh.
Given that Guangdong allows for over 600 charge–discharge cycles per year, the province’s user-side energy storage projects demonstrate strong potential for price-difference arbitrage. This trend aligns with the sharp 359% year-on-year increase in Guangdong’s newly registered user-side storage capacity in September, underscoring its position as a key growth region for user-side energy storage in the future.
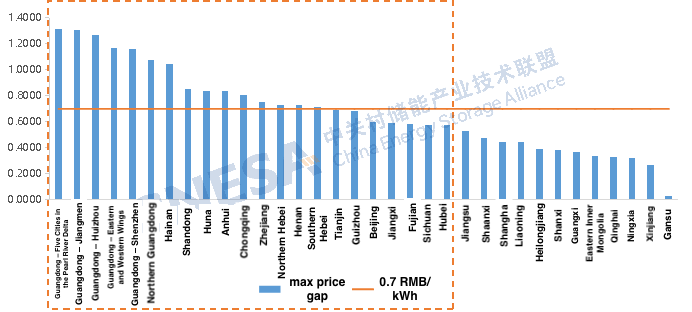
Figure 4. Distribution of Peak-to-Valley Electricity Price Differences by Regional Power Grids, September 2025
Source: Provincial Power Grid Companies; compiled and analyzed by CNESA
Investment returns: The frequent adjustments to time-of-use (TOU) electricity pricing policies have increased uncertainty
However, the recent frequent adjustments to time-of-use (TOU) electricity pricing policies have increased the uncertainty of investment returns for user-side energy storage projects. Overall, market participants remain cautious toward new investments in this segment.
For example, in Zhejiang, the latest TOU pricing consultation draft raises the peak–valley price ratio, but since the pricing base (such as transmission and distribution fees, government funds, and surcharges) is excluded from the floating portion, the actual arbitrage margin has narrowed, leading to a decline in investment returns.
In Jiangsu and Guangdong, although the widened peak–valley gap could increase arbitrage potential, the ongoing adjustments in TOU policy require investors to recalculate returns, adding further uncertainty to the overall profitability of user-side energy storage projects.
Overall Analysis of New Energy Storage Projects in September
According to incomplete statistics from the CNESA DataLink Global Energy Storage Database, as of September 2025, China’s newly commissioned new-type energy storage projects reached a total installed capacity of 3.08 GW / 9.08 GWh, representing a year-on-year increase of 166% and 200%, and a month-on-month increase of 7% and 15%.
In the third quarter, newly added installations totaled 9.16 GW / 25.52 GWh, marking a year-on-year growth of 10% and 24%. Cumulatively, installations in the first three quarters have already reached 74% of last year’s full-year total, indicating that 2025’s new installations are expected to surpass last year’s overall figure.
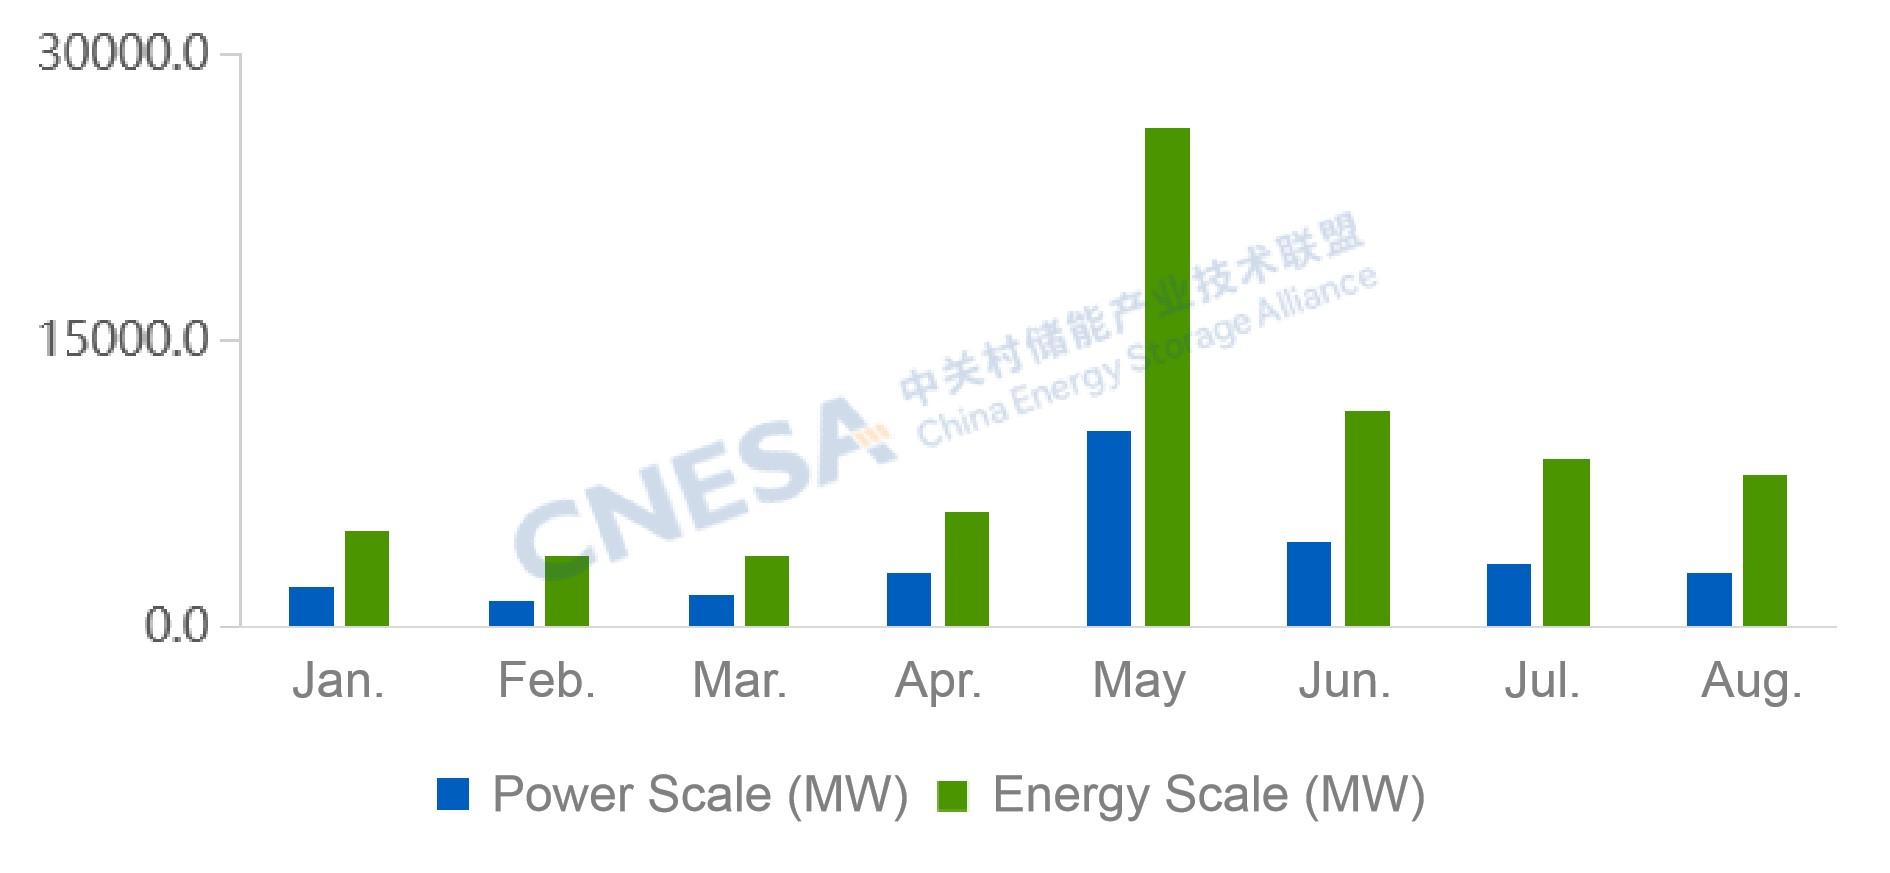
Figure 5. Installed Capacity of Newly Commissioned New Energy Storage Projects in China (January–September 2025)
Source: CNESA DataLink Global Energy Storage Database — https://www.esresearch.com.cn/
Note: Year-on-year (YoY) compares with the same period of the previous year; month-on-month (MoM) compares with the immediately preceding period.
CENSA Upcoming Events:
1. Dec.4-5 | 2025 China Energy Storage CEO Summit | Xiamen, Fujian
Register Now to attend
Read more: http://en.cnesa.org/new-events-1/2025/12/4/dec4-5-2025-china-energy-storage-ceo-summit

2. Apr. 1-3, 2026 | The 14th Energy Storage International Conference & Expo
Register Now to attend, free before Oct 31, 2025.