

Latest News
China Energy Storage Tenders & Awards H1 2026: System and EPC Prices Rebound Across the Board, with 4-Hour ESS Seeing Stronger Growth than 2-Hour Systems
According to incomplete statistics from the CNESA Datalink Global Energy Storage Database, China's new energy storage tendering and award market maintained strong momentum in the first half (H1) of 2026.
During the period, 1,987 new energy storage tender notices were tracked, up 41.8% year-on-year (YoY), while 1,504 contract awards were recorded, representing a 61.0% YoY increase. The projects covered the entire energy storage value chain, including EPC contracting, energy storage systems (ESS), battery cells, battery packs, PCS, EMS, and BMS.
The ESS tender market showed a clear divergence between power and energy capacity. Tendered power reached 24.5 GW, down 3.4% YoY, while tendered energy capacity surged to 148.1 GWh, an 88.3% YoY increase. The combination of slightly lower power capacity and significantly higher energy capacity indicates the continued market shift toward longer-duration energy storage systems.
Meanwhile, EPC tender and award volumes more than doubled year-on-year, significantly outpacing the growth of standalone ESS equipment procurement. This suggests that the market is increasingly favoring turnkey EPC solutions rather than purchasing storage equipment alone.
On pricing, the average winning bid price for 2-hour ESS increased to RMB 602.1 CNY/kWh, up 8.8% YoY, while the average price for 4-hour ESS reached RMB 541.3 CNY/kWh, representing a 21.1% YoY increase. Despite the stronger price growth, 4-hour systems remained less expensive per kWh than 2-hour systems, highlighting their advantages in economies of scale and lower levelized storage costs.
In terms of procurement models, centralized procurement and framework agreements have become standard industry practice. During H1 2026, centralized/framework procurement accounted for 80.6 GWh of ESS tenders, representing more than half of the total tendered capacity, further concentrating market orders among leading suppliers.
01
Tender Market Overview (H1 2026)
Tender Market Scale Overview (H1 2026)
In June 2026, ESS tenders totaled 6.1 GW / 48.3 GWh, representing a 58.5% decline in power capacity but a 37.4% increase in energy capacity compared with the same period last year. Compared with May, power capacity decreased 12.7%, while energy capacity increased 118.1%.
For the first six months of 2026, cumulative ESS tenders reached 24.5 GW / 148.1 GWh, representing -3.4% YoY in power capacity and +88.3% YoY in energy capacity.
Among these, centralized procurement and framework agreements accounted for 80.6 GWh, up 96% YoY, representing 54.4% of the total tendered ESS energy capacity.
EPC Projects (Including PC)
In June 2026, EPC (including PC) tenders reached 19.3 GW / 56.4 GWh, up 111.7% YoY in power capacity and 154.4% YoY in energy capacity. Month-on-month growth reached 41.8% and 43.2%, respectively.
From January to June 2026, cumulative EPC (including PC) tenders totaled 80.1 GW / 227.9 GWh, representing 98.72% YoY growth in power capacity and 112.21% YoY growth in energy capacity.
Among them, grid-side EPC projects accounted for 200.9 GWh, increasing 145.8% YoY and representing 88.2% of the total EPC tendered energy capacity.
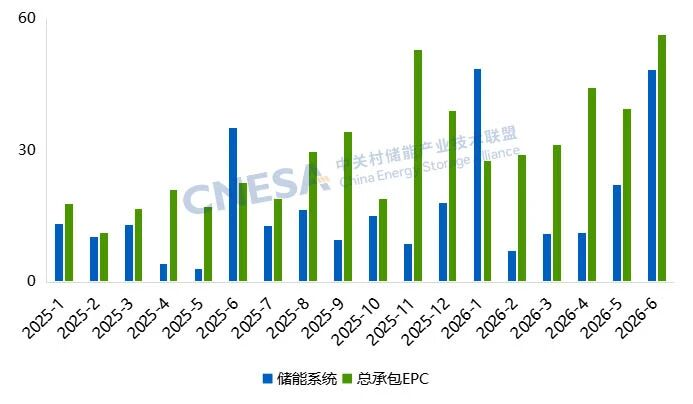
Blue: ESS Green: EPC
Figure 1. ESS and EPC Tender Volumes, January 2025–June 2026 (GWh)
Source: CNESA Datalink Global Energy Storage Database
Distribution of ESS Tender Capacity by Application Scenario (H1 2026):
Based on application scenarios, total ESS tendered energy capacity reached 148.1 GWh during H1 2026.
· Centralized procurement/framework agreements accounted for 80.6 GWh, representing 54.4% of total tendered capacity.
· Grid-side projects totaled 56.4 GWh, of which 99.6% consisted of standalone energy storage projects.
· Power generation-side projects reached 8.1 GWh, with solar-plus-storage and wind-plus-storage accounting for a combined 88.4% of this segment.
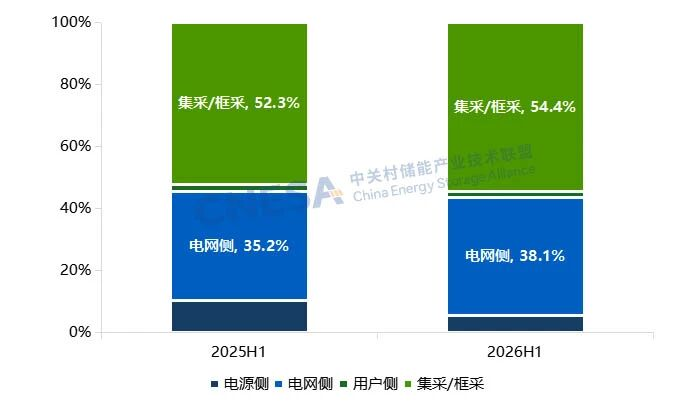
From left to right:Generation-side,Grid-side,Behind-the-Meter (BTM),
Centralized Procurement / Framework Agreements
Figure 2. Distribution of ESS Tender Capacity by Application Scenario, H1 2025 vs. H1 2026 (GWh, %)
Note: Since centralized procurement and framework agreements have not yet identified their final application scenarios, they are categorized separately.
Source: CNESA Datalink Global Energy Storage Database
02
Contract Awards (H1 2026)
Awarded Project Scale Overview (H1 2026)
In June 2026, awarded ESS projects reached 4.7 GW / 13.8 GWh, representing year-on-year growth of 364.9% in power capacity and 341.1% in energy capacity. Compared with May, awarded power capacity increased 53.5%, while energy capacity rose 9.1%.
During H1 2026, cumulative ESS awards totaled 15.0 GW / 96.1 GWh, representing 37.2% YoY growth in power capacity and 12.15% YoY growth in energy capacity.
Centralized procurement and framework agreements accounted for 58.0 GWh, representing 60.1% of total awarded ESS energy capacity, although this figure was 2.13% lower than the same period last year.
EPC Projects (Including PC)
In June 2026, EPC (including PC) awards reached 12.5 GW / 32.3 GWh, increasing 54.3% YoY in power capacity and 87.4% YoY in energy capacity.
Cumulative EPC awards during H1 2026 totaled 56.8 GW / 165.6 GWh, representing 91.87% YoY growth in power capacity and 105.96% YoY growth in energy capacity.
Among these, grid-side projects accounted for 146.5 GWh, up 129.8% YoY, representing 88.5% of the total awarded EPC energy capacity.
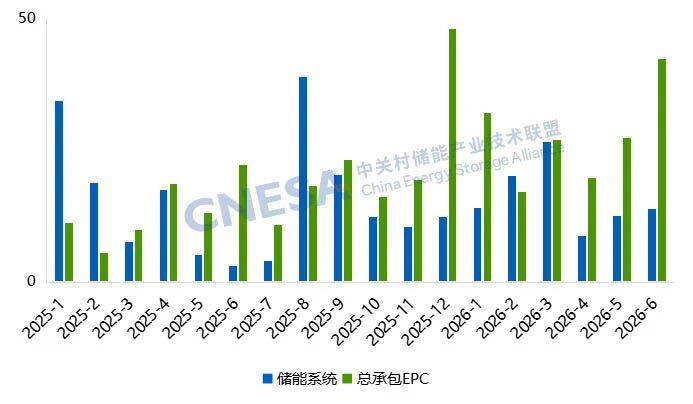
Blue:ESS Green:EPC
Figure 3. ESS and EPC Awarded Capacity, January 2025–June 2026 (GWh)
Source: CNESA Datalink Global Energy Storage Database
ESS Winning Bid Price Analysis (H1 2026):
Overall ESS winning bid prices increased compared with the same period last year, with the overall pricing range shifting upward.
l For 2-hour ESS, the average winning bid price during H1 2026 reached RMB 602.1/kWh, up 8.8% YoY, with prices ranging from RMB 489.0/kWh to RMB 836.0/kWh.
l For 4-hour ESS, the average winning bid price reached RMB 541.3/kWh, representing 21.1% YoY growth, with prices ranging between RMB 420.0/kWh and RMB 781.8/kWh.
Compared with H1 2025, pricing ranges for both 2-hour and 4-hour ESS widened significantly, indicating greater pricing dispersion across projects and increasing differences among market quotations.
Notably, 0.25C ESS experienced the most significant increase in price dispersion, with its pricing range expanding by 108.2% year-on-year.
Although average prices for both 2-hour and 4-hour ESS continued to rise compared with last year, monthly average winning bid prices during H1 2026 indicate that the pace of price increases has gradually stabilized.
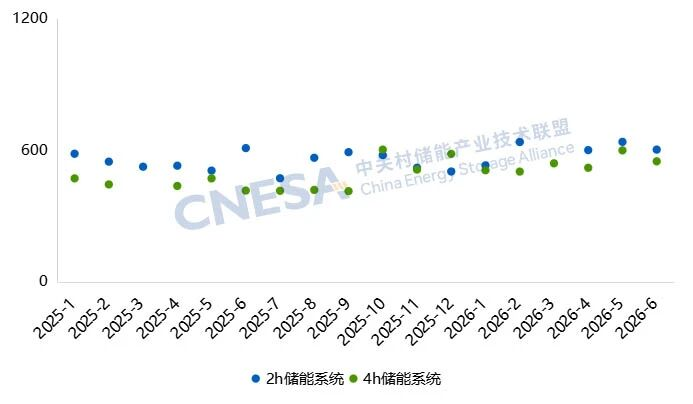
Blue: 2-hour ESS Green: 4-hour ESS
Figure 5. Average Winning Bid Prices for ESS, January 2025–June 2026 (Excluding Centralized Procurement/Framework Agreements and Behind-the-Meter Projects, RMB/kWh)
Source: CNESA Datalink Global Energy Storage Database
EPC Winning Bid Price Analysis (Excluding PC) (H1 2026):
Average EPC winning bid prices (excluding PC) also increased compared with H1 2025.
l For 2-hour EPC projects, the average winning bid price reached RMB 1,040.4/kWh, up 3.2% YoY, with prices ranging from RMB 580.0/kWh to RMB 1,750.1/kWh.
l For 4-hour EPC projects, the average winning bid price reached RMB 958.5/kWh, representing an 8.2% YoY increase, with prices ranging between RMB 645.0/kWh and RMB 1,377.5/kWh.
Regarding price distribution, both the highest and lowest prices for 2-hour EPC projects increased slightly compared with last year.
For 4-hour EPC projects, market quotations became more concentrated. Exceptionally high bids declined, while lower-end prices increased, indicating that pricing is gradually converging toward a more consistent market range and bid pricing has become increasingly standardized.
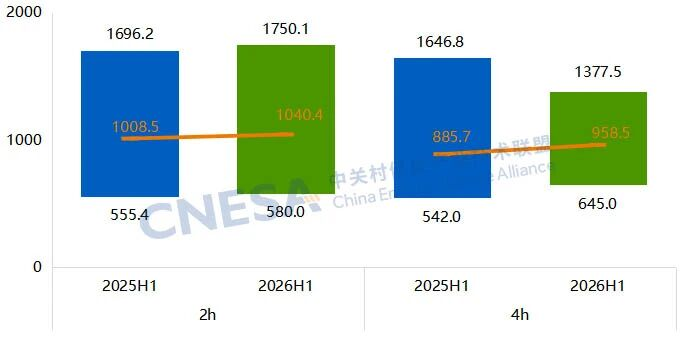
Figure 6. Winning Bid Price Ranges for 2-Hour and 4-Hour EPC Projects (Excluding PC), H1 2025 vs. H1 2026 (Excluding Centralized Procurement/Framework Agreements and Behind-the-Meter Projects, CNY/kWh)
Source: CNESA Datalink Global Energy Storage Database
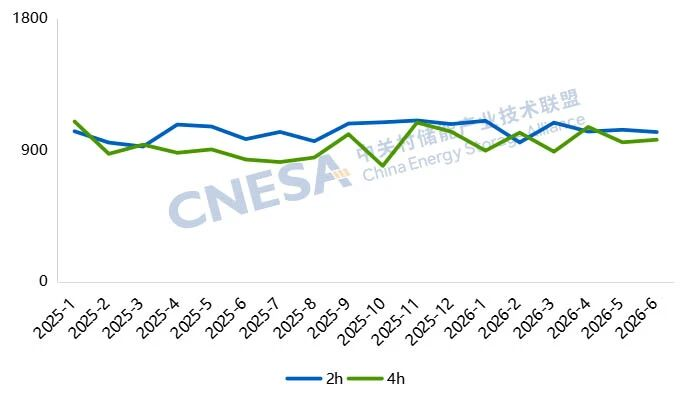
Figure 7. Average Winning Bid Prices for EPC Projects (Excluding PC), January 2025–June 2026 (Excluding Centralized Procurement/Framework Agreements and Behind-the-Meter Projects, CNY//kWh)
Source: CNESA Datalink Global Energy Storage Database
Sign up for our free monthly newsletter to stay informed about the Chinese energy storage market.