

Latest News
Bookmark This! Six Long-Duration Energy Storage Technology Pathways, Three Revenue Models, and Prospects for Large-Scale Deployment
With multiple supportive policies being introduced, long-duration energy storage (LDES) is entering a period of significant growth opportunities!
Recently, the State Council of China issued the “15th Five-Year Plan Carbon Peak Action Plan”, while the National Energy Administration released the “Energy Sector Energy Conservation and Carbon Reduction Action Plan (2026–2028)”. Both policy documents explicitly emphasized the development of long-duration energy storage, indicating that LDES is gradually becoming an essential component of the new power system.
Currently, LDES technologies are developing toward greater diversification. Technologies such as compressed air energy storage (CAES), flow batteries, and hydrogen energy storage each demonstrate different advantages and limitations in terms of technology maturity, application scenarios, and construction costs.
This article provides a systematic analysis of LDES from three perspectives: technology development, revenue structures, and prospects for large-scale deployment, offering industry insights and references.
Six Technology Pathways Leading LDES Development for Diverse Applications
Long-duration energy storage technologies are diverse and mainly include:
Physical energy storage technologies, represented by pumped hydro storage, compressed air energy storage, and gravity energy storage;
Electrochemical energy storage technologies, represented by flow batteries and metal-air batteries;
Thermal energy storage (including cooling storage) and chemical energy storage technologies, represented by hydrogen energy storage.
Among them, pumped hydro storage is currently the most mature and widely deployed long-duration energy storage technology.
As of the first quarter of 2026, China’s operational pumped hydro storage capacity had reached 67.09 GW.
At present, pumped hydro storage is primarily based on large-scale fixed-speed pumped hydro power stations. However, as suitable sites for large-scale pumped hydro projects become increasingly limited, the development of small- and medium-scale pumped hydro storage projects is gradually increasing.

Gravity Energy Storage
The operating principle of gravity energy storage is similar to pumped hydro storage. It mainly uses the physical lifting and lowering of solid masses to drive power generation equipment, thereby achieving energy storage and discharge.
Currently, China’s 100 MWh-scale gravity energy storage tower demonstration project has been completed in Rudong, Jiangsu Province, and has entered the grid connection commissioning stage.
The project, invested and developed by China Tianying, has an energy storage capacity of 100 MWh and a power output of 25–26 MW. It is expected to be connected to the grid and begin operation by the end of 2026.
Compressed Air Energy Storage
Compressed air energy storage is another long-duration energy storage technology with significant potential for large-scale application.
The technology converts electricity from off-peak periods or curtailed renewable energy into compressed air pressure energy and thermal energy, storing them separately in air storage units and thermal storage units.
During periods of high electricity demand, the stored high-pressure air is released and expanded through turbines to generate electricity.
Currently, large-scale engineering applications mainly focus on adiabatic compressed air energy storage systems with thermal storage.
According to statistics from the China Energy Storage Alliance (CNESA), as of the first quarter of 2026, China had 14 operational compressed air energy storage projects connected to the grid, with a cumulative installed capacity exceeding 1.5 GW.
The total installed capacity of projects under construction and in the planning stage has exceeded 54 GW.

Flow Batteries
Flow batteries are electrochemical batteries in which the active materials of both the positive and negative electrodes are liquid.
Depending on the types of active electrode materials, flow batteries can be categorized into:
Vanadium redox flow batteries (VRFBs);
Zinc-bromine flow batteries;
Iron-chromium flow batteries;
and other technology pathways.
Overall, flow batteries offer advantages including:
high safety;
no risk of explosion or fire;
long service life;
deep charge and discharge capability;
and environmental friendliness.
By the end of 2025, China’s 10 kW-scale vanadium redox flow battery demonstration projects had already entered operation.
Thermal Energy Storage
Thermal energy storage refers to storing energy from sources such as:
solar thermal energy;
geothermal energy;
industrial waste heat;
low-grade waste heat;
and releasing it when needed, thereby addressing mismatches between thermal energy supply and demand caused by differences in time, location, or energy intensity.
Based on storage principles, thermal energy storage technologies can be categorized into three types:
sensible heat storage;
latent heat storage;
thermochemical energy storage.
Currently, relatively mature thermal storage materials include:
hot water;
molten salt;
refractory bricks;
and other thermal storage media.
Hydrogen Energy Storage
Hydrogen energy storage is a form of chemical energy storage that enables:
large-scale energy storage;
long-duration storage;
and cross-regional energy storage.
It mainly consists of three key stages:
hydrogen production;
hydrogen storage and transportation;
hydrogen utilization.
Water electrolysis for hydrogen production is expected to become the dominant future technology pathway.
Hydrogen storage and transportation technologies include:
gaseous hydrogen storage;
liquid hydrogen storage;
solid-state hydrogen storage;
ammonia (alcohol)-based hydrogen storage;
underground hydrogen storage;
and other approaches.
In the power sector, hydrogen energy can generate electricity mainly through:
hydrogen gas turbines;
hydrogen internal combustion engines;
hydrogen fuel cells.
Different LDES Technologies Demonstrate Distinct Competitive Advantages
Different long-duration energy storage technology pathways demonstrate diverse technical characteristics and competitive advantages.
In terms of efficiency, pumped hydro storage and gravity energy storage achieve relatively high efficiency, while molten salt thermal storage and hydrogen energy storage have comparatively lower efficiency.
Regarding service life, physical energy storage technologies such as pumped hydro storage, compressed air energy storage, and gravity energy storage generally offer longer lifetimes.
In terms of safety, most LDES technologies demonstrate high safety levels, except hydrogen energy storage, which requires additional safety considerations.
Regarding environmental adaptability, pumped hydro storage and compressed air energy storage have relatively limited adaptability to certain environmental conditions.
In terms of response speed, flow batteries demonstrate significant advantages.
Lifecycle Cost of Energy Storage Determines Economic Competitiveness
The levelized cost of electricity (LCOE) over the full lifecycle is a key indicator for evaluating the economic performance of energy storage technologies.
According to estimates from the China Energy Storage Alliance (CNESA), when the storage duration reaches 8 hours, salt cavern compressed air energy storage and pumped hydro storage currently demonstrate relatively lower lifecycle electricity costs.
With continuous technological advancement and large-scale deployment, the lifecycle costs of emerging long-duration energy storage technologies are expected to continue declining.
According to projections, by 2035, mainstream LDES technologies including:
compressed air energy storage;
pumped hydro storage;
flow batteries;
molten salt thermal storage;
could achieve lifecycle electricity costs of approximately:
RMB 0.3–0.5/kWh
under conditions of 250 annual utilization cycles.
If calculated based on each technology’s inherent lifecycle cycle life, the lifecycle cost of energy storage could decline even further.
Revenue Channels Established, Value of Long-Duration Storage Yet to Be Fully Released
Currently, the development of market mechanisms for long-duration energy storage is accelerating its transition from policy-driven growth toward market-driven development.
The three-part revenue structure of:
“Energy Market + Capacity Market + Ancillary Services Market”
is gradually moving from the stage of framework establishment toward detailed implementation.

Energy Market: The Most Fundamental Revenue Source
The energy market is currently the most fundamental and primary revenue source for long-duration energy storage.
The core business logic is:
“Charge during low-price periods and discharge during high-price periods.”
Compared with 2-hour energy storage systems, the key advantage of LDES lies in its ability to provide:
cross-period energy shifting;
large-scale electricity time-shifting capability;
and flexible short-term operation.
Some technology pathways can also achieve multiple daily cycles, allowing them to capture more price arbitrage opportunities.
In provinces where electricity spot markets are relatively mature, peak-valley price differences have become a major revenue source for energy storage projects.
Taking compressed air energy storage as an example, the first phase of the Jintan Salt Cavern Compressed Air Energy Storage National Demonstration Project in Jiangsu, which began operation in 2024, has an installed capacity of:
60 MW / 300 MWh
The project can achieve:
one charge and two discharge cycles per day;
or multiple charge-discharge operations within a day.
Capacity Market: Providing Long-Term Reliability Value
Unlike the “price arbitrage” mechanism of the energy market, the core logic of the capacity market is the “value of availability” — meaning that energy storage systems commit to remaining available whenever the power grid requires support.
This mechanism is particularly important for long-duration energy storage because:
it requires higher upfront investment costs;
it has a longer payback period;
and it requires stable baseline revenues to improve project bankability.
Currently, the development of capacity markets in China demonstrates a dual-track approach, which is gradually removing market access barriers for long-duration energy storage.
On one hand, the coal-fired power capacity pricing mechanism began nationwide implementation in 2024, providing a stable revenue foundation for the transformation of thermal power generation.
On the other hand, the Notice on Improving the Capacity Electricity Pricing Mechanism for the Generation Side, released in January this year, established for the first time at the national policy level a capacity electricity pricing mechanism for independent new-type energy storage systems on the grid side.
Based on the principle of “equal pay for equal performance,” independent energy storage has officially been incorporated into the generation-side capacity pricing mechanism.
The capacity payment mechanism for independent energy storage has therefore evolved from regional exploration toward a nationwide unified framework.

Ancillary Services Market: Unlocking Additional Value
If the energy market addresses the question of “whether energy storage can generate revenue,” the ancillary services market determines “whether energy storage can generate additional value.”
Currently, power ancillary service markets mainly include three categories:
frequency regulation;
peak shaving;
backup reserve.
In regions where electricity spot markets operate on a regular basis, peak-shaving ancillary services have gradually been replaced by spot energy markets, with their original functions being absorbed by electricity trading mechanisms.
Meanwhile, some provinces have begun pilot programs for new ancillary services, including:ramping support;
inertia support;
and other grid flexibility services.
Long-duration energy storage can provide:long-cycle energy shifting;
backup reserve capability;
and some technology pathways can also provide physical inertia, effectively supporting grid stability requirements.
However, although the three-part revenue structure appears relatively complete, the current market mechanism still mainly focuses on the question of “whether energy storage exists”, without further distinguishing “how long energy storage can provide service.”
The differentiated advantages of LDES — including:cross-time energy shifting;
large capacity;
high reliability;
have not yet been fully translated into market revenues.
This remains the most significant challenge in current market mechanism development and represents a key area requiring further breakthroughs.
Technology and Market Mechanisms Advancing Together to Support Demonstration Deployment
At the recently held Energy Storage International Conference and Expo (ESIE2026), Ma Yuan, Assistant Researcher at the Department of Earth System Science of Tsinghua University, stated that by 2030, energy storage capacity should account for 15%–20% of total renewable energy installed capacity, reaching a key milestone of approximately 400 GW.
Among this capacity, long-duration energy storage with durations exceeding 8 hours should account for at least 20% in order to effectively reduce renewable energy curtailment and ensure power system security.
According to forecasts from the China Energy Storage Alliance (CNESA), during the 15th Five-Year Plan period, demand for long-duration energy storage will gradually become more prominent.
New LDES demand during this period will mainly focus on storage durations of:
4–10 hours
Under a conservative scenario, the market scale is expected to reach:
180 GW
while under an optimistic scenario, it could reach:
250 GW
Pumped hydro storage will remain the dominant technology, complemented by emerging LDES technologies such as:compressed air energy storage;
electrochemical energy storage.
However, this scale still falls short of the requirements of power grid companies.
In some northwestern provinces with high renewable energy penetration, demand for 24-hour-plus long-duration energy storage is expected to emerge first.
By 2035, the scale of long-duration energy storage is expected to reach:300 GW under a conservative scenario;
400 GW under an optimistic scenario.
Storage durations will mainly range from:
4–24 hours
while the deployment scale of emerging LDES technologies will continue to increase.
Accelerating the Transition from Technology Demonstration to Large-Scale Deployment
To continuously promote the transition of long-duration energy storage from technology demonstration to large-scale commercial application, more projects need to be implemented to transform technological maturity into commercial viability.
1. Coordinated Demonstration of Different Technology Pathways
Currently, emerging LDES projects face challenges including:technologies that are not yet fully mature;
incomplete industrial supply chains;
relatively high investment costs.
As a result, commercial applications remain dominated by short-duration lithium-ion battery energy storage.
Going forward, demonstration and deployment of LDES technologies should be promoted in an orderly manner based on different stages of technological development.
This approach will accelerate the implementation of emerging technologies while driving industrial technology upgrades and improving market competitiveness.
2. Promote Scenario-Specific Demonstration Projects Based on Local Conditions
Under the new power system framework, different application scenarios have different requirements for long-duration energy storage.
For example:developed cities in eastern China have relatively higher requirements for energy density;
northwestern “desert, Gobi, and barren land” regions;
eastern coastal areas;
and cold regions in northeastern China;
all have different requirements regarding:operating temperature;
humidity resistance;
sand and dust protection;
and environmental adaptability.
Therefore, demonstration projects should be combined with different application environments to deepen research into key technologies including:energy storage equipment;
system integration;
safety protection;
and operational reliability.
3. Strengthen Long-Term Monitoring and Evaluation of Demonstration Projects
Currently, management and evaluation mechanisms for demonstration projects are not yet sufficiently comprehensive.
In the future, long-term tracking, monitoring, and periodic evaluation should be carried out for demonstration projects.
This will provide scientific data support for:the practical application of new technologies;
new products;
and innovative solutions.
It will also provide evidence-based support for national industrial policies and technical standards.
4. Encourage Demonstration Projects to Explore Innovative Policies and Business Models
While demonstrating LDES technologies, pilot projects should also serve as platforms for exploring innovative commercial models.
At the same time, improving policy mechanisms and market support systems will be a critical foundation for large-scale LDES development.
Establishing Cost Recovery Mechanisms for Long-Duration Energy Storage
Compared with short-duration energy storage, LDES demonstrates greater value through:capacity contribution;
long-term backup capability;
and system reliability support.
Therefore, it is necessary to gradually establish market-based capacity cost recovery mechanisms.
Through market competition and pricing mechanisms, investment entities can be encouraged to make reasonable investments, ensuring long-term adequacy of power system capacity.
Improving Cost Allocation Mechanisms for Long-Duration Energy Storage
Long-duration energy storage can directly or indirectly accelerate the replacement of traditional fossil fuel power generation with renewable energy, significantly reducing overall societal carbon emissions.
In the future, policy and market frameworks for:green electricity;
green electricity certificates;
carbon trading;
should be further developed.
These mechanisms can better reflect the value of LDES in:energy transition;
carbon reduction;
and renewable energy integration.
By expanding revenue sources and improving cost allocation mechanisms, the economic foundation for long-duration energy storage can be further strengthened.
Conclusion
Long-duration energy storage is becoming an increasingly important pillar of future power systems as renewable energy deployment accelerates.
With continuous technological innovation, improved market mechanisms, and increasing project deployment, LDES is expected to move from early-stage demonstration toward large-scale commercialization.
The future development of long-duration energy storage will depend not only on breakthroughs in individual technologies, but also on the coordinated evolution of:technology pathways;
market structures;
business models;
and policy frameworks.
Together, these factors will unlock the full value of LDES in supporting renewable energy integration, enhancing grid flexibility, and enabling the global energy transition.
China Energy Storage Tenders & Awards H1 2026: System and EPC Prices Rebound Across the Board, with 4-Hour ESS Seeing Stronger Growth than 2-Hour Systems
According to incomplete statistics from the CNESA Datalink Global Energy Storage Database, China's new energy storage tendering and award market maintained strong momentum in the first half (H1) of 2026.
During the period, 1,987 new energy storage tender notices were tracked, up 41.8% year-on-year (YoY), while 1,504 contract awards were recorded, representing a 61.0% YoY increase. The projects covered the entire energy storage value chain, including EPC contracting, energy storage systems (ESS), battery cells, battery packs, PCS, EMS, and BMS.
The ESS tender market showed a clear divergence between power and energy capacity. Tendered power reached 24.5 GW, down 3.4% YoY, while tendered energy capacity surged to 148.1 GWh, an 88.3% YoY increase. The combination of slightly lower power capacity and significantly higher energy capacity indicates the continued market shift toward longer-duration energy storage systems.
Meanwhile, EPC tender and award volumes more than doubled year-on-year, significantly outpacing the growth of standalone ESS equipment procurement. This suggests that the market is increasingly favoring turnkey EPC solutions rather than purchasing storage equipment alone.
On pricing, the average winning bid price for 2-hour ESS increased to RMB 602.1 CNY/kWh, up 8.8% YoY, while the average price for 4-hour ESS reached RMB 541.3 CNY/kWh, representing a 21.1% YoY increase. Despite the stronger price growth, 4-hour systems remained less expensive per kWh than 2-hour systems, highlighting their advantages in economies of scale and lower levelized storage costs.
In terms of procurement models, centralized procurement and framework agreements have become standard industry practice. During H1 2026, centralized/framework procurement accounted for 80.6 GWh of ESS tenders, representing more than half of the total tendered capacity, further concentrating market orders among leading suppliers.
01
Tender Market Overview (H1 2026)
Tender Market Scale Overview (H1 2026)
In June 2026, ESS tenders totaled 6.1 GW / 48.3 GWh, representing a 58.5% decline in power capacity but a 37.4% increase in energy capacity compared with the same period last year. Compared with May, power capacity decreased 12.7%, while energy capacity increased 118.1%.
For the first six months of 2026, cumulative ESS tenders reached 24.5 GW / 148.1 GWh, representing -3.4% YoY in power capacity and +88.3% YoY in energy capacity.
Among these, centralized procurement and framework agreements accounted for 80.6 GWh, up 96% YoY, representing 54.4% of the total tendered ESS energy capacity.
EPC Projects (Including PC)
In June 2026, EPC (including PC) tenders reached 19.3 GW / 56.4 GWh, up 111.7% YoY in power capacity and 154.4% YoY in energy capacity. Month-on-month growth reached 41.8% and 43.2%, respectively.
From January to June 2026, cumulative EPC (including PC) tenders totaled 80.1 GW / 227.9 GWh, representing 98.72% YoY growth in power capacity and 112.21% YoY growth in energy capacity.
Among them, grid-side EPC projects accounted for 200.9 GWh, increasing 145.8% YoY and representing 88.2% of the total EPC tendered energy capacity.
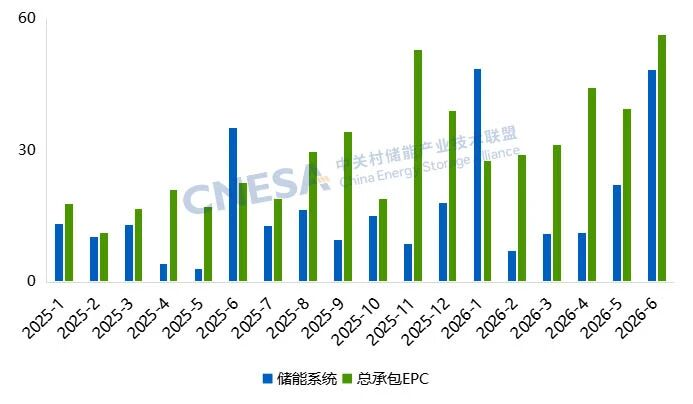
Blue: ESS Green: EPC
Figure 1. ESS and EPC Tender Volumes, January 2025–June 2026 (GWh)
Source: CNESA Datalink Global Energy Storage Database
Distribution of ESS Tender Capacity by Application Scenario (H1 2026):
Based on application scenarios, total ESS tendered energy capacity reached 148.1 GWh during H1 2026.
· Centralized procurement/framework agreements accounted for 80.6 GWh, representing 54.4% of total tendered capacity.
· Grid-side projects totaled 56.4 GWh, of which 99.6% consisted of standalone energy storage projects.
· Power generation-side projects reached 8.1 GWh, with solar-plus-storage and wind-plus-storage accounting for a combined 88.4% of this segment.
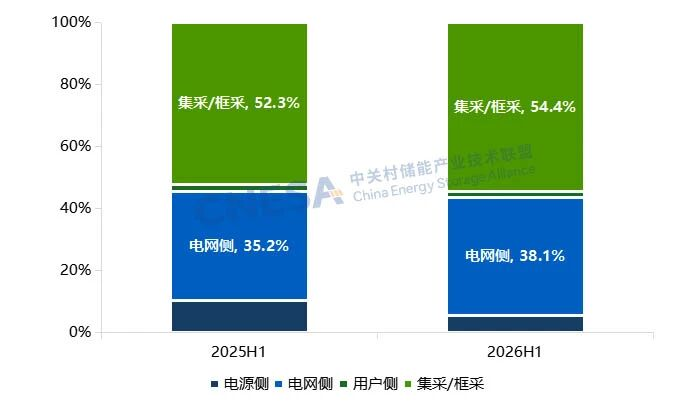
From left to right:Generation-side,Grid-side,Behind-the-Meter (BTM),
Centralized Procurement / Framework Agreements
Figure 2. Distribution of ESS Tender Capacity by Application Scenario, H1 2025 vs. H1 2026 (GWh, %)
Note: Since centralized procurement and framework agreements have not yet identified their final application scenarios, they are categorized separately.
Source: CNESA Datalink Global Energy Storage Database
02
Contract Awards (H1 2026)
Awarded Project Scale Overview (H1 2026)
In June 2026, awarded ESS projects reached 4.7 GW / 13.8 GWh, representing year-on-year growth of 364.9% in power capacity and 341.1% in energy capacity. Compared with May, awarded power capacity increased 53.5%, while energy capacity rose 9.1%.
During H1 2026, cumulative ESS awards totaled 15.0 GW / 96.1 GWh, representing 37.2% YoY growth in power capacity and 12.15% YoY growth in energy capacity.
Centralized procurement and framework agreements accounted for 58.0 GWh, representing 60.1% of total awarded ESS energy capacity, although this figure was 2.13% lower than the same period last year.
EPC Projects (Including PC)
In June 2026, EPC (including PC) awards reached 12.5 GW / 32.3 GWh, increasing 54.3% YoY in power capacity and 87.4% YoY in energy capacity.
Cumulative EPC awards during H1 2026 totaled 56.8 GW / 165.6 GWh, representing 91.87% YoY growth in power capacity and 105.96% YoY growth in energy capacity.
Among these, grid-side projects accounted for 146.5 GWh, up 129.8% YoY, representing 88.5% of the total awarded EPC energy capacity.
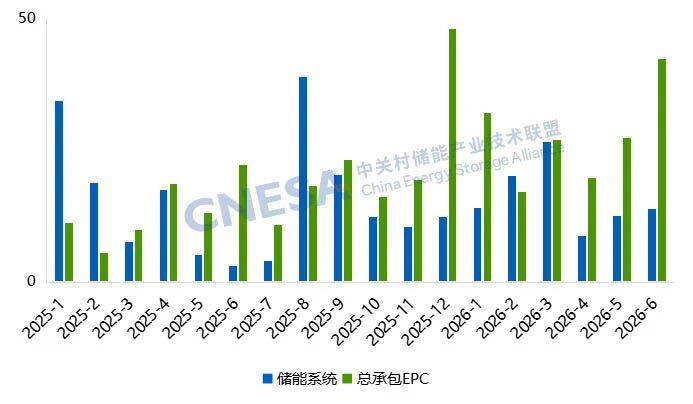
Blue:ESS Green:EPC
Figure 3. ESS and EPC Awarded Capacity, January 2025–June 2026 (GWh)
Source: CNESA Datalink Global Energy Storage Database
ESS Winning Bid Price Analysis (H1 2026):
Overall ESS winning bid prices increased compared with the same period last year, with the overall pricing range shifting upward.
l For 2-hour ESS, the average winning bid price during H1 2026 reached RMB 602.1/kWh, up 8.8% YoY, with prices ranging from RMB 489.0/kWh to RMB 836.0/kWh.
l For 4-hour ESS, the average winning bid price reached RMB 541.3/kWh, representing 21.1% YoY growth, with prices ranging between RMB 420.0/kWh and RMB 781.8/kWh.
Compared with H1 2025, pricing ranges for both 2-hour and 4-hour ESS widened significantly, indicating greater pricing dispersion across projects and increasing differences among market quotations.
Notably, 0.25C ESS experienced the most significant increase in price dispersion, with its pricing range expanding by 108.2% year-on-year.
Although average prices for both 2-hour and 4-hour ESS continued to rise compared with last year, monthly average winning bid prices during H1 2026 indicate that the pace of price increases has gradually stabilized.
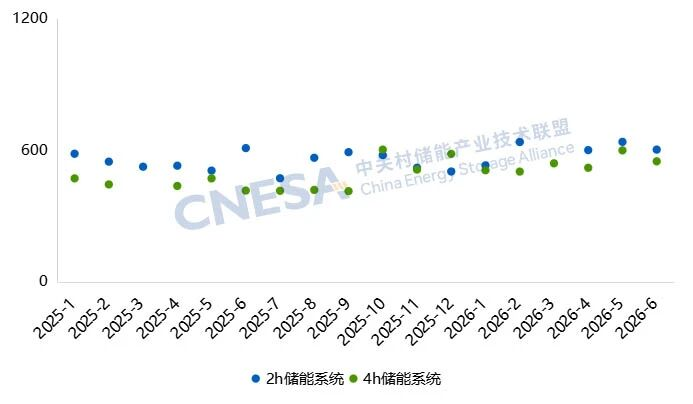
Blue: 2-hour ESS Green: 4-hour ESS
Figure 5. Average Winning Bid Prices for ESS, January 2025–June 2026 (Excluding Centralized Procurement/Framework Agreements and Behind-the-Meter Projects, RMB/kWh)
Source: CNESA Datalink Global Energy Storage Database
EPC Winning Bid Price Analysis (Excluding PC) (H1 2026):
Average EPC winning bid prices (excluding PC) also increased compared with H1 2025.
l For 2-hour EPC projects, the average winning bid price reached RMB 1,040.4/kWh, up 3.2% YoY, with prices ranging from RMB 580.0/kWh to RMB 1,750.1/kWh.
l For 4-hour EPC projects, the average winning bid price reached RMB 958.5/kWh, representing an 8.2% YoY increase, with prices ranging between RMB 645.0/kWh and RMB 1,377.5/kWh.
Regarding price distribution, both the highest and lowest prices for 2-hour EPC projects increased slightly compared with last year.
For 4-hour EPC projects, market quotations became more concentrated. Exceptionally high bids declined, while lower-end prices increased, indicating that pricing is gradually converging toward a more consistent market range and bid pricing has become increasingly standardized.
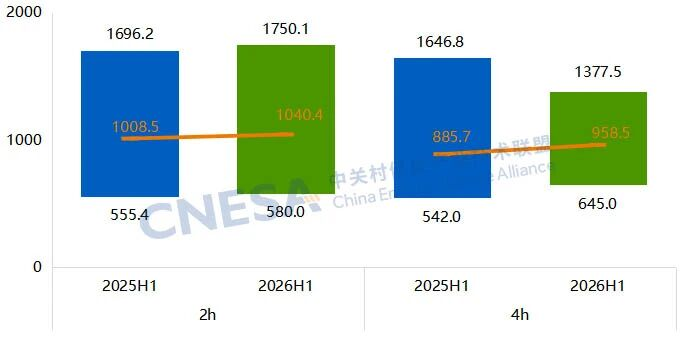
Figure 6. Winning Bid Price Ranges for 2-Hour and 4-Hour EPC Projects (Excluding PC), H1 2025 vs. H1 2026 (Excluding Centralized Procurement/Framework Agreements and Behind-the-Meter Projects, CNY/kWh)
Source: CNESA Datalink Global Energy Storage Database
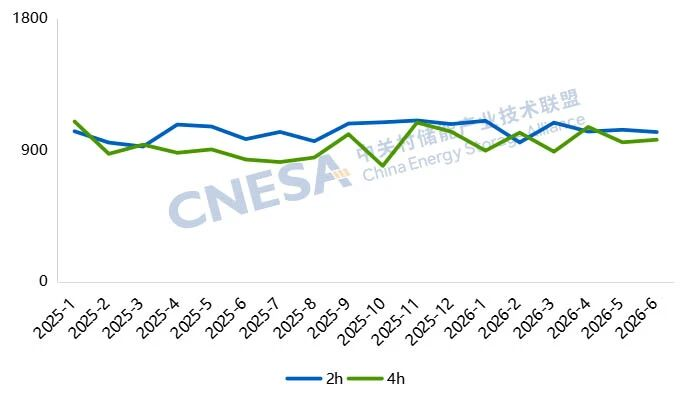
Figure 7. Average Winning Bid Prices for EPC Projects (Excluding PC), January 2025–June 2026 (Excluding Centralized Procurement/Framework Agreements and Behind-the-Meter Projects, CNY//kWh)
Source: CNESA Datalink Global Energy Storage Database
New Installations Surge Over 120% YoY — February Analysis of China’s New Energy Storage Projects
In February 2026, China’s new energy storage market sustained its rapid growth momentum, with newly installed capacity increasing by over 120% year-on-year (YoY). Meanwhile, the application structure of the market has undergone adjustments compared with the same period last year.
In February 2026, China’s new energy storage market sustained its rapid growth momentum, with newly installed capacity increasing by over 120% year-on-year (YoY). Meanwhile, the application structure of the market has undergone adjustments compared with the same period last year.
Short-term fluctuations do not alter long-term growth trend: In February, newly installed capacity reached 3.6 GW, representing a YoY increase of over 120% and a month-on-month (MoM) decline of 31%. Despite the short-term slowdown, the long-term growth trajectory of the energy storage market remains strong.
Front-of-the-meter standalone storage drives growth: Standalone energy storage on the generation and grid side became the primary growth driver. In February, standalone storage accounted for 90% of newly added capacity, up 42 percentage points YoY. Newly installed power and energy capacity of standalone storage increased by more than 310% and 270% YoY, respectively.
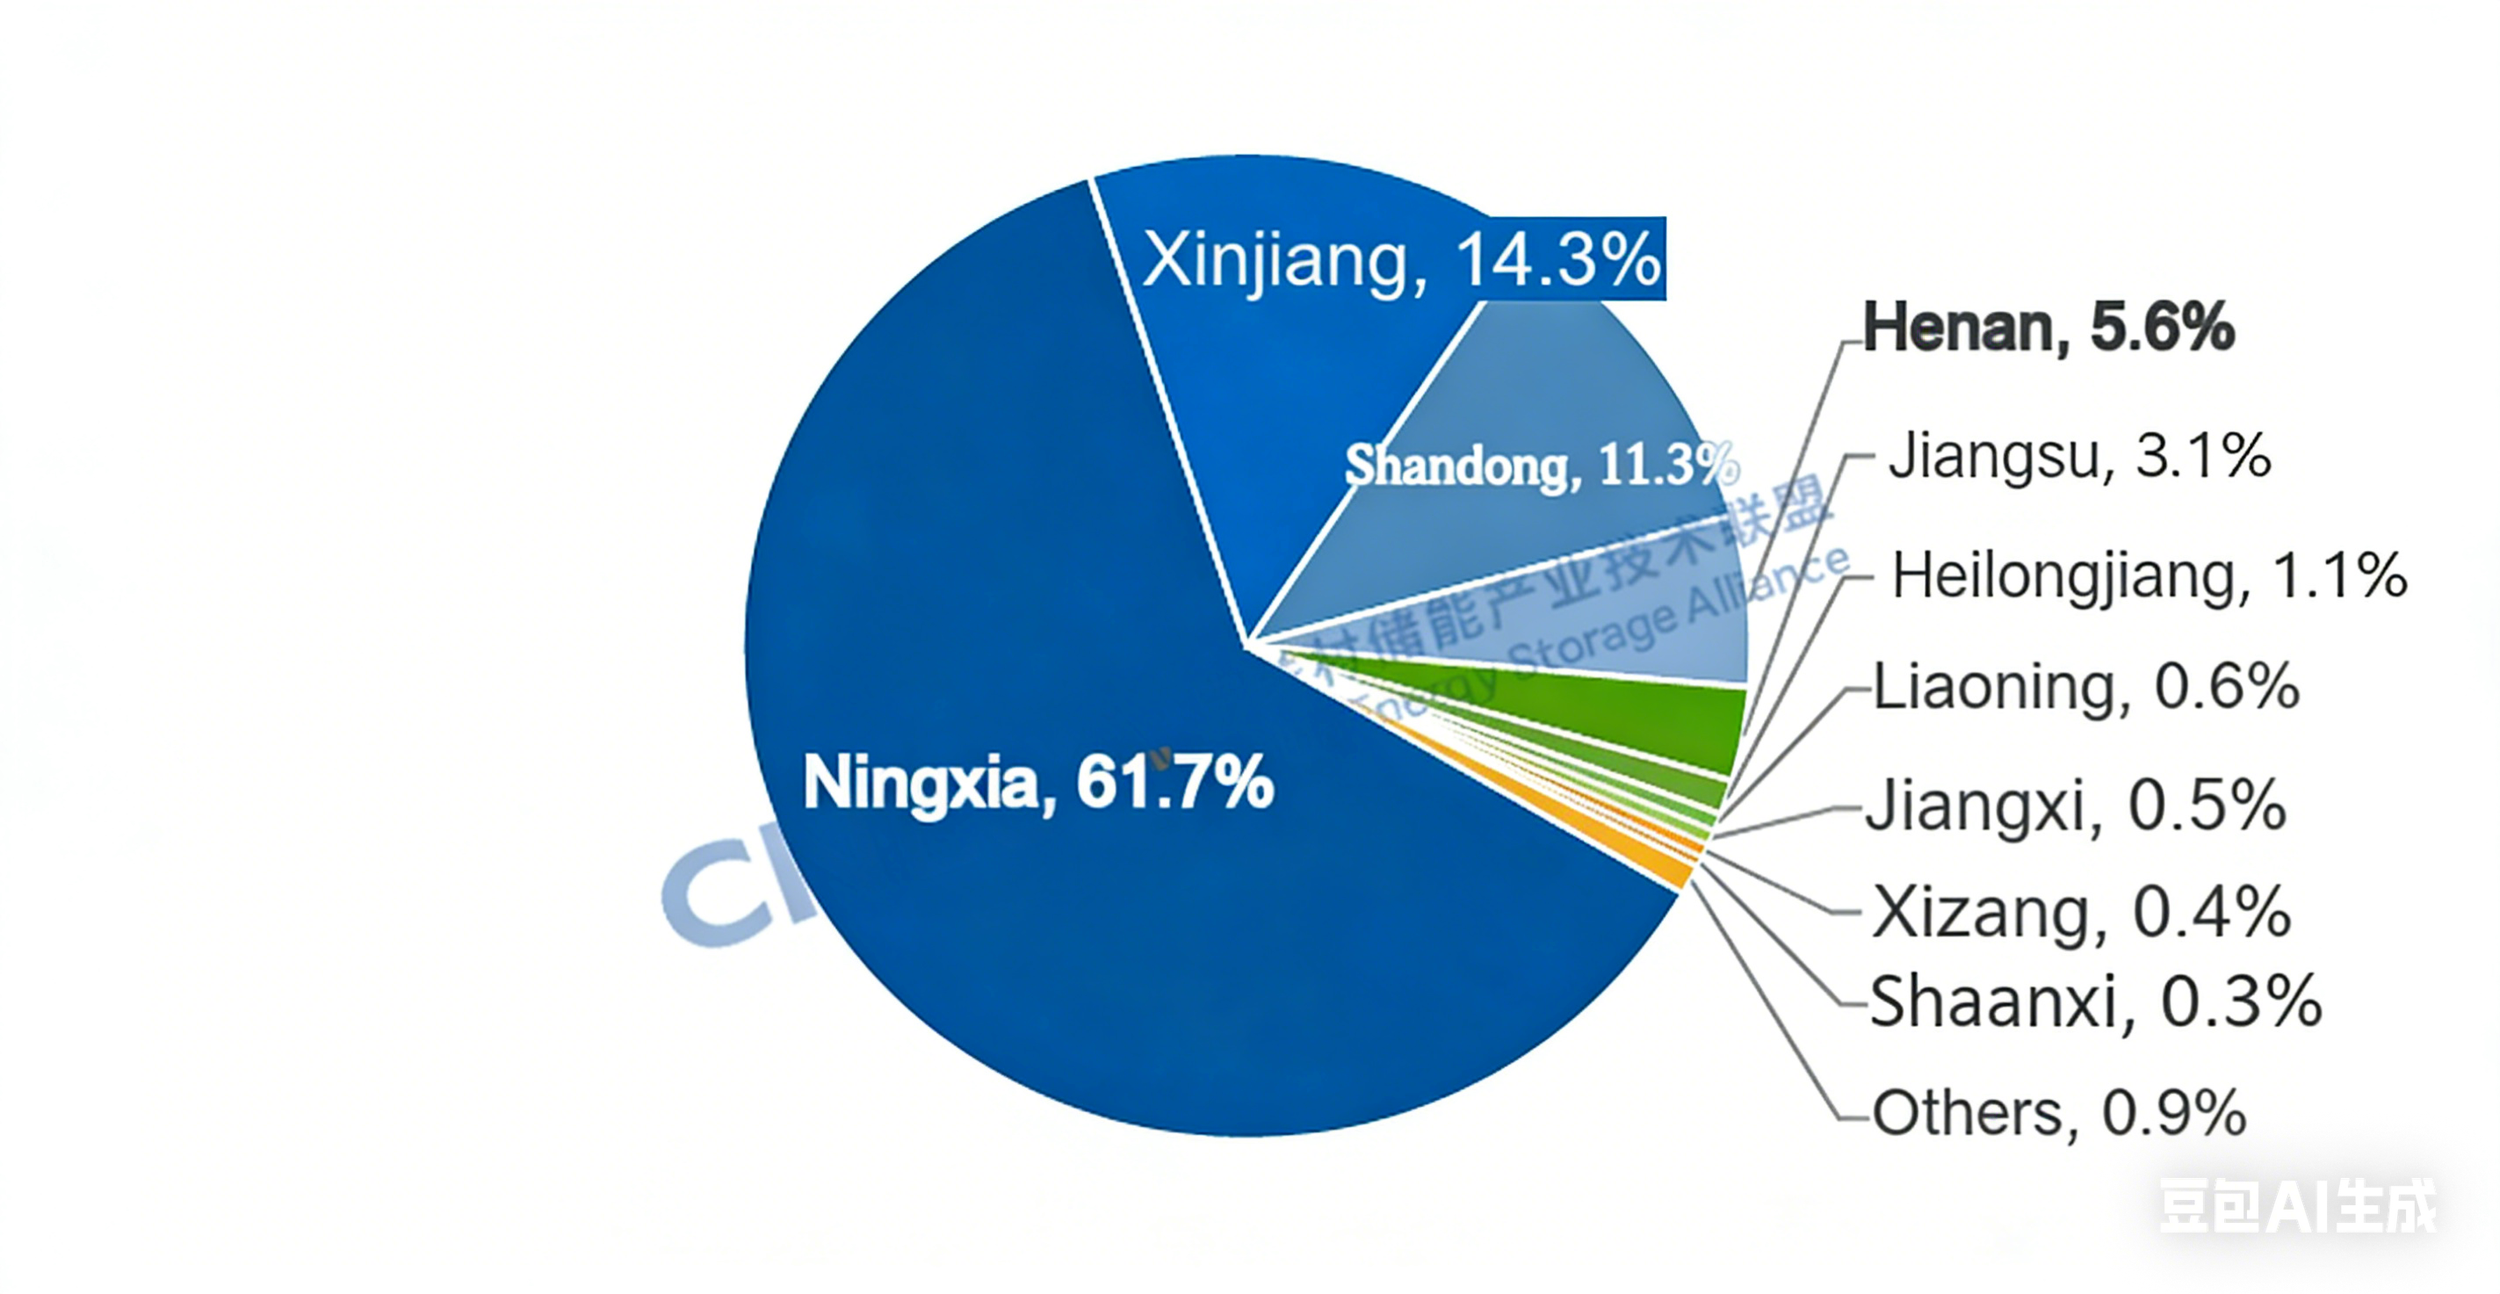
Highly concentrated regional deployment: The Northwest region accounted for over 75% of total additions, with Ningxia alone exceeding 2 GW, contributing more than 60% of the national total.
According to incomplete statistics from China Energy Storage Alliance(CNESA), China commissioned 3.56 GW / 8.19 GWh of new energy storage capacity in February 2026, representing YoY increases of +120% / +95% and MoM declines of -31% / -21%.
The MoM decline was mainly due to project construction cycles and the impact of the Spring Festival holiday. However, the YoY growth exceeding 120% indicates a fundamentally positive market outlook. Notably, front-of-the-meter (FTM) installations reached 3.4 GW, up 147% YoY, effectively doubling the total monthly additions.
Key Market Characteristics in February
1. Standalone Storage Surges Over 270%, Driving Market Expansion
In terms of application structure, standalone energy storage dominated the market. It accounted for 90% of total newly installed power capacity, up 42 percentage points YoY and 8 percentage points MoM. Newly added capacity reached 3.2 GW / 7.4 GWh, with YoY growth of +313% / +274%, becoming the main driving point of energy storage market. All newly commissioned standalone energy storage projects reached at least the 100 MW level, with the number of such projects rising by 29% year-on-year, alongside the commissioning of two gigawatt-scale projects.
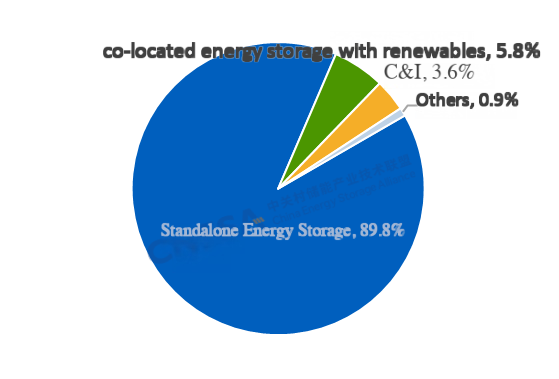
Installations on the generation side and behind-the-meter (BTM) user side experienced a temporary decline. Newly installed capacity on the generation side reached 217.3 MW / 474.3 MWh, down 65% / 72% year-on-year and 41% / 36% month-on-month. Co-located storage with renewable energy remained the dominant model, covering a range of application scenarios such as aquaculture, solar hybrid projects and desertification control initiatives.
New user-side installations totaled 135.2 MW / 292.7 MWh, down 41% / 42% year-on-year and 51% / 58% month-on-month. The market was highly concentrated, with Jiangsu, Guangdong, and Zhejiang accounting for 90% of total user-side energy storage capacity, while Jiangsu ranked first nationwide in both installed capacity and project count.
On the technology front, lithium-ion batteries continued to scale rapidly, supporting the commissioning of gigawatt-level standalone storage plants. Meanwhile, hybrid systems combining lithium-ion and sodium-ion batteries at the 100 MW level were deployed, and aqueous organic flow batteries were implemented on the user side, providing more diversified technological pathways for long-term development.

2. Regional Concentration Intensifies, Northwest China Dominates
In February, regional concentration of new installations was pronounced. The Northwest region added 2.7 GW, accounting for 76% of the national total. The combined share of the Northwest and North China regions exceeded 90%. Ningxia added 2.2 GW / 4.4 GWh of new capacity, ranking first nationwide in both power and energy scale and setting a new monthly record for the region. This surge was driven by the grid connection of several gigawatt-scale shared energy storage projects and storage systems paired with large renewable energy bases.
By the end of 2025, Ningxia’s renewable energy capacity reached 57.32 GW, accounting for 65.5% of total grid capacity under centralized dispatch. Solar power has surpassed coal-fired generation to become the largest power source in the region. Due to the intermittency of renewables—characterized by surplus generation during the day and shortages at night—demand for grid services such as peak shaving and frequency regulation has surged. A coordinated development model integrating wind, solar, thermal power, and energy storage is rapidly taking shape. Looking ahead, energy storage is expected to generate revenue through multiple channels, including capacity compensation, spot market trading, frequency regulation services, ramp rate support and so on.
In addition, Ningxia has introduced policies encouraging private capital participation in energy storage investment. In February, a gigawatt-scale storage project developed by Jiayang Energy was commissioned, demonstrating strong investor confidence in the region. At the end of February, the region released its first batch of 2026 private investment promotion projects, including 22 energy storage projects with a total scale of 4.15 GW / 14.4 GWh, providing a solid pipeline for continued market growth.
Register now to attend Asia’s Largest Energy Storage Trade Show for free:
What: The 14th Energy Storage International Conference & Expo
When: Conferences: March 31 - April 2, 2026
Exhibitions: April 1-3, 2026
Where: CIECC Beijing, China
Address: No. 55 Yudong road, Shunyi District, Beijing China

2.1GW+7.75GWh! China Power Construction Group Signed One of the Largest Solar-Plus-Storage Projects in the UAE
Recently, China Power Construction Group officially signed the EPC contract for the 2.1GW + 7.75GWh RTC solar-plus-storage project in Abu Dhabi, United Arab Emirates (UAE), with a contract value of approximately RMB 13.962 billion. As one of the largest integrated solar-plus-storage projects in the Middle East and even the world, the signing of the contract marks the project’s transition into the full implementation phase, which is projected to be delivered in 2027.
Recently, China Power Construction Group officially signed the EPC contract for the 2.1GW + 7.75GWh RTC solar-plus-storage project in Abu Dhabi, United Arab Emirates (UAE), with a contract value of approximately RMB 13.962 billion. As one of the largest integrated solar-plus-storage projects in the Middle East and even the world, the signing of the contract marks the project’s transition into the full implementation phase, which is projected to be delivered in 2027.
Amid the accelerating global energy transition and the impact of geopolitical on energy supply, solar-plus-storage systems, as independent and controllable energy solutions, is witnessing an explosive growth in demand. Industry forecasts suggest that large-scale solar-plus-storage projects are being tendered in rapid succession worldwide, with the Middle East emerging as a key engine of market demand, providing significant growth opportunities for the energy storage sector.
Notably, the overseas business of China Power Construction Group has demonstrated strong performance this year. Data indicates a significant increase in the share of overseas operations. According to the company’s operational report of January-February 2026 released on March 12, China Power Construction Group signed RMB 147.893 billion in new contracts during the first two months of the year. Among them, overseas contracts reached RMB 40.888 billion, representing a year-on-year increase of 19.92%. Despite broader market pressures, overseas business continued to expand, with its share of newly signed contracts rising from around 21% in the same period last year to approximately 27%.
Register now to attend Asia’s Largest Energy Storage Trade Show for free:
What: The 14th Energy Storage International Conference & Expo
When: Conferences: March 31 - April 2, 2026
Exhibitions: April 1-3, 2026
Where: CIECC Beijing, China
Address: No. 55 Yudong road, Shunyi District, Beijing China

DOE now requires energy storage for large-scale renewable energy projects
To improve national grid stability, the Department of Energy (DOE) has issued a new directive requiring all large-scale renewable energy projects to integrate energy storage systems (ESS).
To improve national grid stability, the Department of Energy (DOE) has issued a new directive requiring all large-scale renewable energy projects to integrate energy storage systems (ESS).
Under Department Circular No. DC2026-02-0008, issued Thursday, all prospective variable renewable energy (VRE) power plants with a capacity of 10 megawatts (MW) or higher must now include energy storage. The storage component must represent at least 20% of the plant’s total installed capacity.
The policy marks a significant shift in how the Philippines manages the inherent intermittency of solar and wind power. By mandating “batteries” or other storage technologies, the DOE aims to mitigate sudden generation losses and ensure a more dependable electricity supply.
“Energy storage is not only about storing surplus energy, it is about strengthening the grid’s capability to absorb more renewables while maintaining reliability,” said Energy Secretary Sharon S. Garin. “This policy ensures that ESS integration becomes part of system planning and project development, supporting better outcomes for consumers”.
The circular also encourages developers to use advanced technologies, such as grid-forming (GFM) inverters. These tools provide “virtual inertia,” helping to stabilize the grid’s voltage and frequency during fluctuations—functions traditionally provided by fossil fuel-based plants.
Beyond private power plants, the DOE has instructed the Transmission Network Provider (TNP) and distribution utilities to incorporate energy storage into their long-term infrastructure strategies. This includes treating storage as a critical resource for grid reinforcement, frequency control, and as an alternative supply for “islanding” scenarios where areas are temporarily cut off from the main grid.
The government plans to institutionalize these requirements by reflecting them in upcoming updates to the Philippine Energy Plan (PEP) and the Transmission Development Plan (TDP). According to the DOE, the updated framework is intended to create stronger signals for investors while accelerating the country’s clean energy targets. (JLN/PIA-NCR)
Source: Philippine Information Agency
_________________________________________________________________
Register now to attend Asia’s Largest Energy Storage Trade Show for free:
What: The 14th Energy Storage International Conference & Expo
When: Conferences: March 31 - April 2, 2026
Exhibitions: April 1-3, 2026
Where: CIECC Beijing, China
Address: No. 55 Yudong road, Shunyi District, Beijing China

Jinko ESS SunTera 5MWh Passes Stringent Large-Scale Fire Test, Validating Safety Boundaries
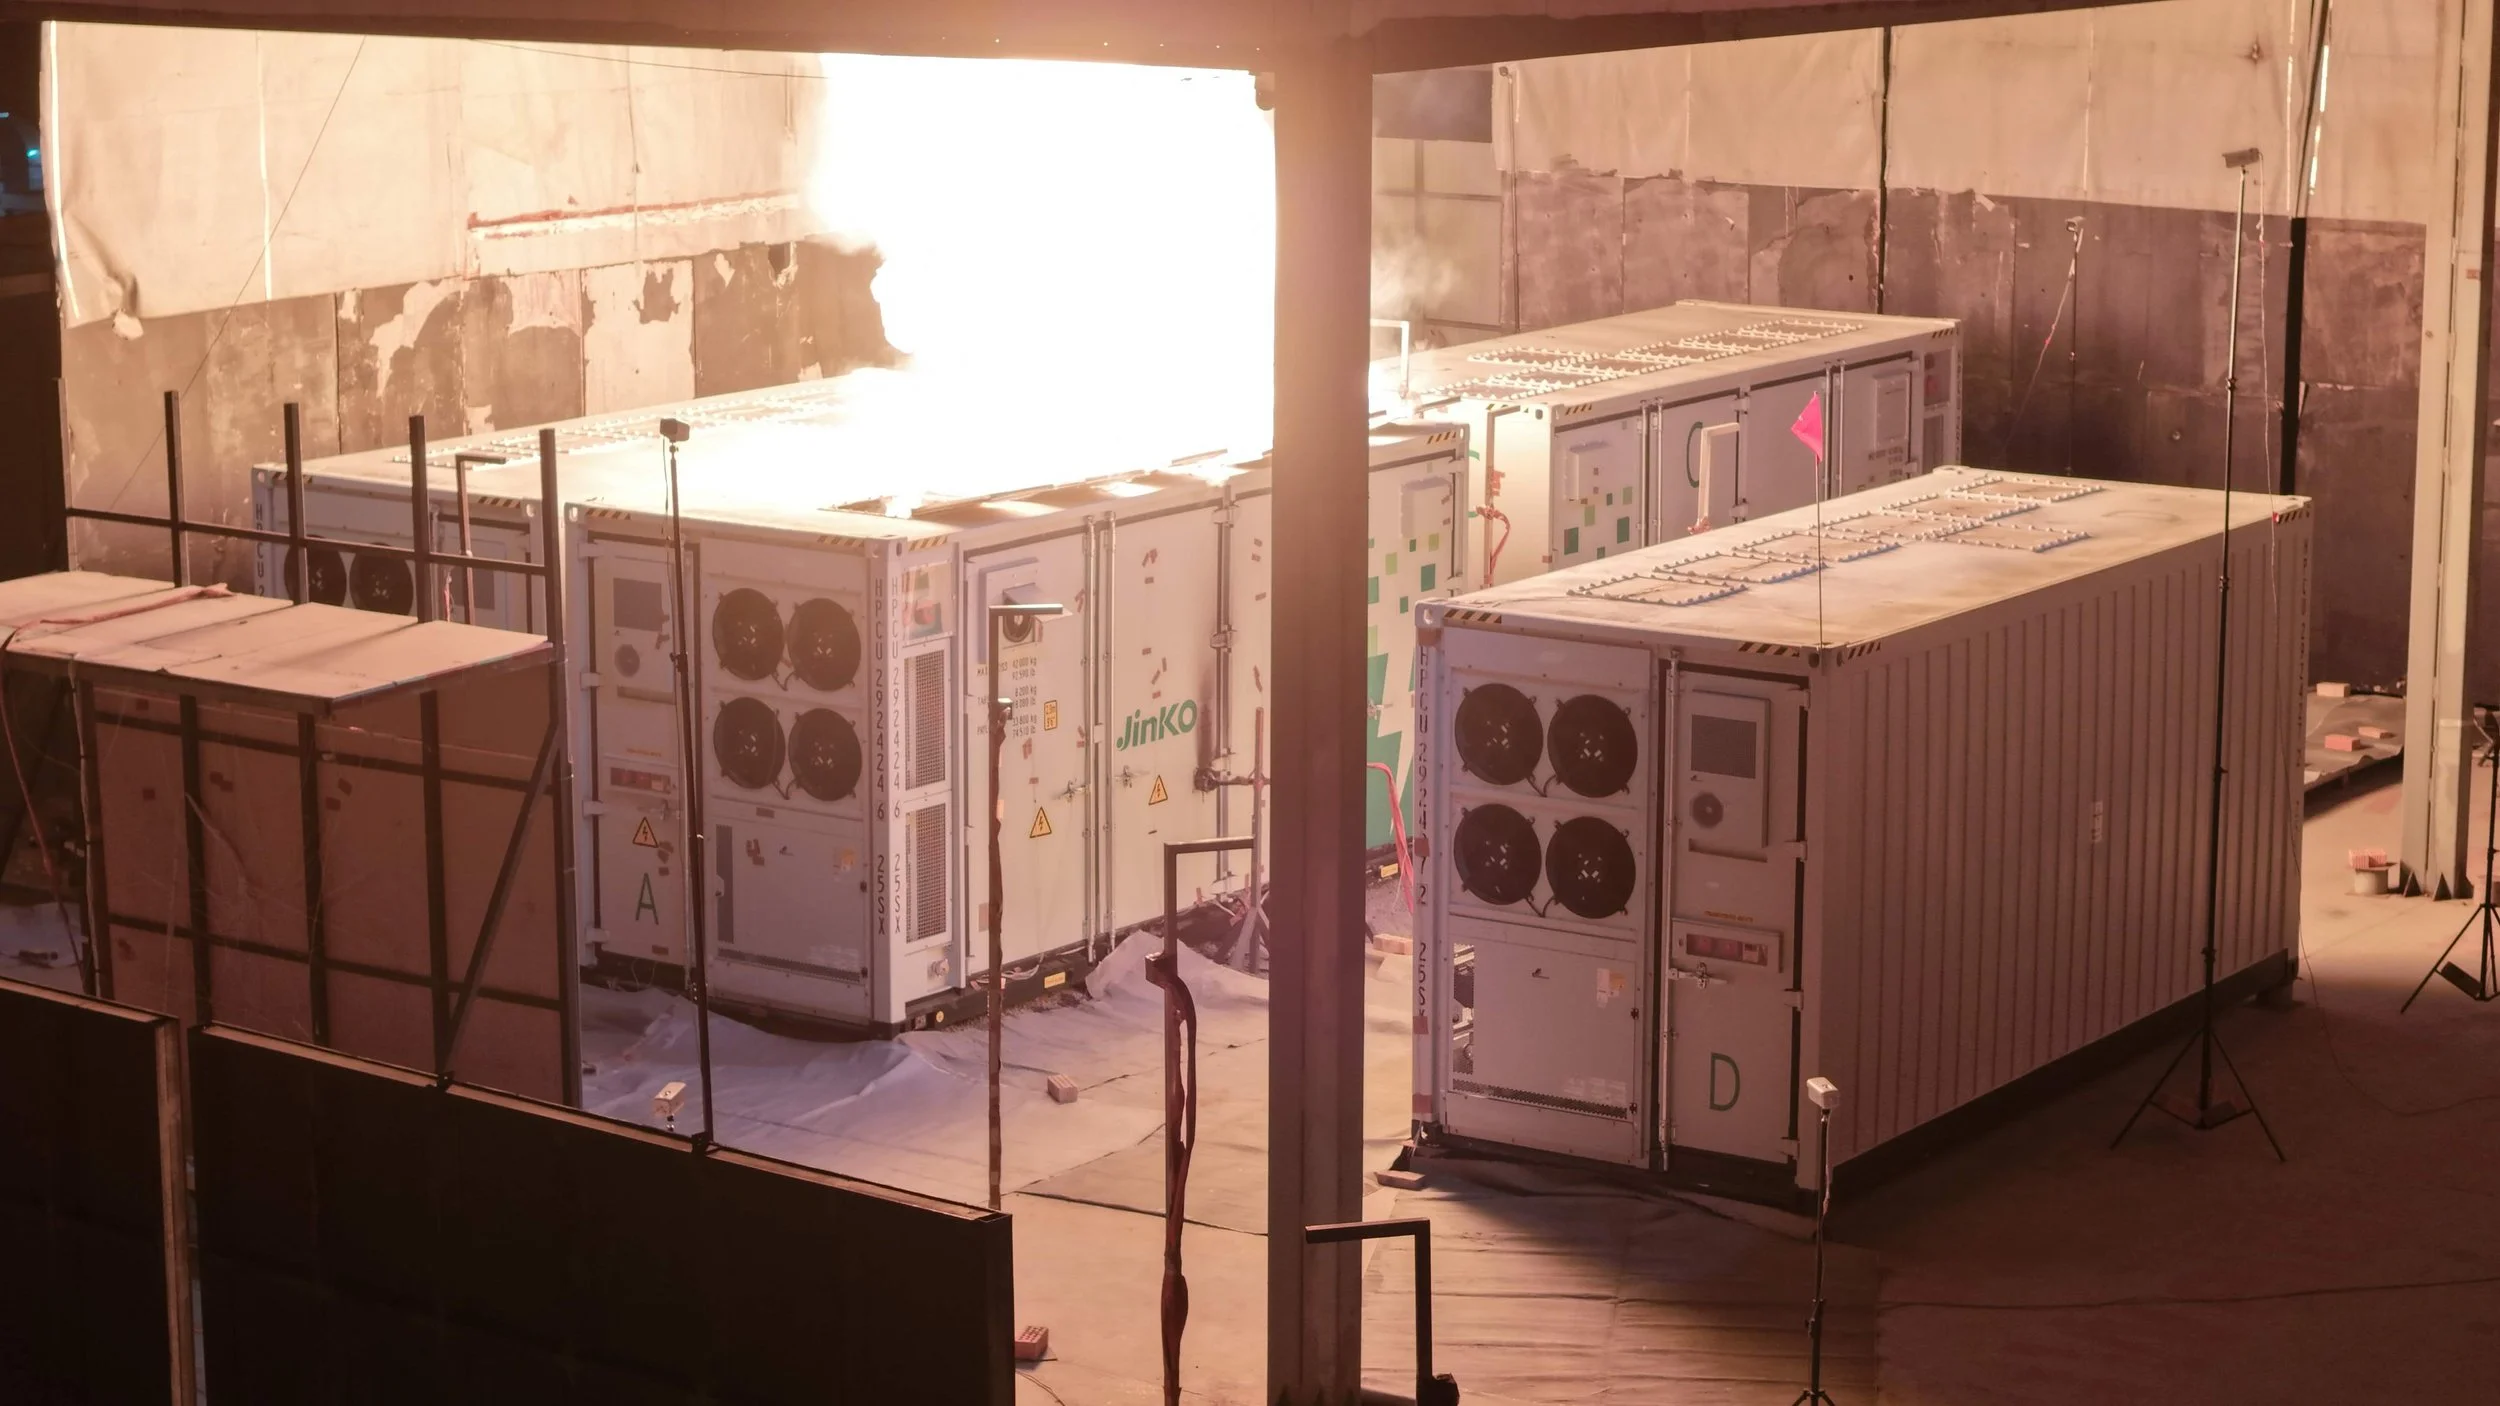
Jinko ESS, a global leading energy storage solution provider and a subsidiary of Jinko Solar Co., Ltd., recently announced the successful completion of a large-scale fire test for SunTera 5MWh Liquid-Cooling Energy Storage System. Conducted at a specialized testing facility in Suzhou City, Anhui Province, the test followed the CSA C800 standard and the November 2025 draft of UL 9540A and was witnessed on-site by CSA Group representatives and North American fire protection engineers.
Jinko ESS, a global leading energy storage solution provider and a subsidiary of Jinko Solar Co., Ltd., recently announced the successful completion of a large-scale fire test for SunTera 5MWh Liquid-Cooling Energy Storage System. Conducted at a specialized testing facility in Suzhou City, Anhui Province, the test followed the CSA C800 standard and the November 2025 draft of UL 9540A and was witnessed on-site by CSA Group representatives and North American fire protection engineers.
By simulating fire scenarios under real-world utility-scale deployment conditions, the evaluation assessed fire behavior, thermal runaway propagation potential, enclosure integrity, and the impact on adjacent units. These results provide measured data under the Large-Scale Fire Testing (LSFT) framework referenced in the forthcoming NFPA 855:2026 provisions, supporting the industry’s transition from compliance-driven safety toward performance-validated safety.
Engineering Performance Under Conservative Conditions
The SunTera 5MWh system is Jinko ESS’s flagship product, built on a high-capacity 314Ah cell platform. The system features advanced liquid-cooling thermal management, a nominal energy capacity of 5.015MWh, and supports 0.5P continuous charge and discharge. With an IP55 protection rating and C4/C5 corrosion resistance, it is designed for a 20-year operational life.
For this evaluation, four SunTera containers were deployed in a high-density configuration to replicate practical project spacing:
l Unit A (Initiating Unit): Target unit for forced ignition.
l Unit B: Back-to-back with Unit A at a 15cm spacing.
l Unit C: Side-by-side with Unit A at a 1m spacing.
l Unit D: Face-to-face with Unit A at a 3.5m spacing.
To evaluate passive protection performance under conservative conditions, all units were charged to 100% State of Charge (SOC), active fire suppression systems were disabled, and no manual intervention occurred during the test.
Measured Results: Effective Propagation Containment
On February 10, 2026, forced heating of Unit A commenced at 17:00. At approximately 18:10, cells reached ignition conditions, resulting in sustained combustion. During the event, the internal temperature of Unit A peaked at 1296°C.
Despite the intensity of the initiating fire, adjacent units remained stable. Maximum recorded internal cell temperatures were significantly below thermal runaway thresholds (Unit B: 51.3°C, Unit C: 38.3°C, Unit D: 41.2°C)。
Although external surface temperatures of adjacent enclosures reached elevated levels—up to 404°C on Unit D due to direct flame exposure—internal battery module temperatures remained within safe limits. This demonstrates effective enclosure-level thermal insulation and fire containment performance.
The fire self-extinguished at 07:50 on February 11, with a total combustion duration of approximately 13 hours and 40 minutes. Post-test inspections confirmed:
l Structural Integrity: Unit A maintained its structure with localized surface soot and no enclosure collapse. Units B, C, and D remained structurally intact.
l Functional Continuity: Functional testing verified that adjacent units (B, C, and D) retained full electrical functionality, with no observable impact on charge and discharge performance.
l Environmental Responsibility: The test incorporated controlled flue gas capture and treatment measures to minimize environmental impact.
Leadership Perspectives
“Large-scale fire test allows us to better quantify fire propagation limits,” said Carl Yang, Product General Manager of Jinko ESS. “The SunTera 5MWh system demonstrated thermal runaway containment within a single enclosure under challenging conditions. These data support more precise installation spacing guidance and contribute to reducing multi-unit propagation risk.”
Dora Zhao, Senior Product Management Engineer, said: “SunTera’s safety architecture is built on a three-level design philosophy: cell-level stability, pack-level insulation with engineered pressure relief, and system-level fire barriers. Even when insulation materials in the initiating pack were intentionally modified to accelerate ignition, adjacent packs maintained electrical functionality.”
Patrick Rimel, North America Product Manager, highlighted the market implications: “As regulatory frameworks evolve toward risk quantification, empirical data from LSFT becomes essential. These results provide AHJs, insurers, and project owners with performance-based insights that can inform permitting decisions and risk evaluations, especially in high-density deployments.”
Independent Expert Validation
Todd LaBerge, Fire Protection Engineer from ATAR FIRE, commented: “The test was conducted in accordance with CSA C800 and the latest UL 9540A draft. The system incorporates deflagration protection principles aligned with NFPA 68 and NFPA 69. With enclosure doors closed and venting mechanisms engaged, the initiating fire remained contained within the originating enclosure. The test execution and data integrity meet internationally recognized best-practice standards.”
The Significance Beyond Validation
The impact of large-scale fire testing extends far beyond mere technical validation. It serves as a mirror, reflecting the true safety boundaries of product design, and a yardstick, measuring a company’s fundamental commitment to risk responsibility.
For Jinko ESS, this test marks a new beginning. We remain committed to transforming "extreme conditions" into "standard configurations," working alongside global partners to build a more resilient power system grounded in data-driven trust and safety-first principles.
_________________________________________________________________________________________
Register now to attend Asia’s Largest Energy Storage Trade Show for free:
What: The 14th Energy Storage International Conference & Expo
When: Conferences: March 31 - April 2, 2026
Exhibitions: April 1-3, 2026
Where: CIECC Beijing, China
Address: No. 55 Yudong road, Shunyi District, Beijing China

Sharp Pullback! User-Side Energy Storage Additions in January Down 58% Year-on-Year
In January 2026, China’s user-side new energy storage market recorded a year-on-year decline of more than 50% in newly added capacity. The pace of project filings slowed while quality improved, and market deployment shifted toward larger single projects and more capital-intensive investments.
In January 2026, China’s user-side new energy storage market recorded a year-on-year decline of more than 50% in newly added capacity. The pace of project filings slowed while quality improved, and market deployment shifted toward larger single projects and more capital-intensive investments.
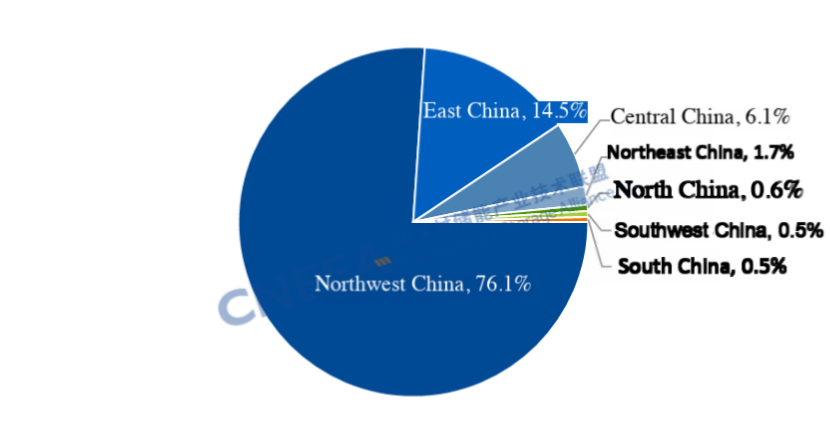
The user-side energy storage market experienced a clear correction, with installed capacity down 58% year-on-year. Commercial and industrial (C&I) energy storage accounted for more than 90% of total additions.
The East China region contributed over three-quarters of newly commissioned capacity. Jiangsu led the nation, accounting for 60% of total installed capacity.
Nationwide, the number of newly filed user-side projects fell by 38% year-on-year, while the average size of individual projects increased by 87%. Core markets—Jiangsu, Guangdong, and Zhejiang—continued to lead, as user-side deployment shifted from small, distributed projects toward larger-scale, more centralized investments.
Analysis of User-Side New Energy Storage Projects in January
In January, newly commissioned user-side energy storage capacity totaled 166.2 MW / 456.5 MWh, representing -58% / -39% year-on-year and -81% / -73% month-on-month. The following characteristics were observed.
(1) Installed capacity of user-side energy storage
In January, the market remained dominated by C&I applications, accounting for over 90% of total additions. Newly commissioned C&I projects reached 156.7 MW / 435.4 MWh, down 60% / 41% year-on-year and 82% / 74% month-on-month.
From a technology perspective, all newly commissioned projects adopted electrochemical energy storage. Lithium iron phosphate (LFP) batteries accounted for more than 99% of installed power capacity. In the long-duration energy storage, one 7-hour photovoltaic-plus-storage integrated smart power station project and one 4-hour solid-state lead battery energy storage project were commissioned.
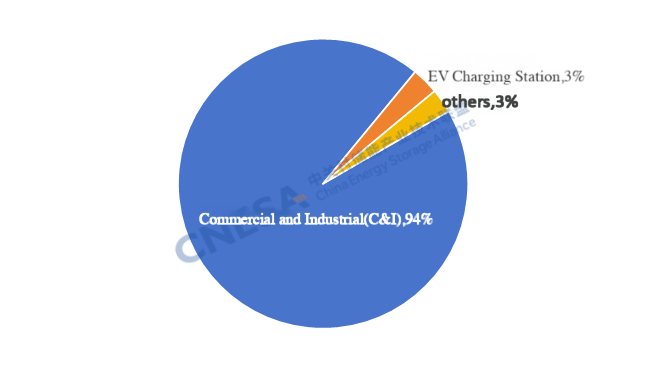
Figure 1. Application distribution of newly commissioned user-side new energy storage projects in January 2026 (MW %)
Source: CNESA DataLink
Note: “C&I” includes industrial facilities, industrial parks, and commercial buildings; “Others” include mining areas, oilfields, rail transit, data centers, etc.
(2) Regional Distribution of User-Side Energy Storage
By region, newly commissioned projects were distributed across 13 provinces, including Jiangsu, Anhui, Shandong, Sichuan, and Guangdong. East China dominated the January market, accounting for 78% of newly added capacity and 44% of total project numbers.
At the provincial level, Jiangsu ranked first nationwide, contributing 60% of total installed power capacity and 16% of newly commissioned projects. Both installed capacity and project count ranked first nationally. This performance was driven by a combination of power market reforms, demand response incentives, strong C&I demand, and the centralized grid connection of large-scale projects.
On the policy front, multiple supportive measures were introduced, accelerating the transition of user-side energy storage business models from “fixed arbitrage” to “volatility-driven optimization.” In January, Jiangsu implemented new power market reforms, with the Jiangsu Energy Regulatory Office releasing the Implementation Rules for the Jiangsu Medium- and Long-Term Power Market (Draft for Comments). These rules marked a shift in C&I electricity pricing from fixed time-of-use tariffs to fully market-based pricing. In the short term, this reduced fixed peak–valley arbitrage margins; however, in the medium to long term, more frequent price fluctuations are expected to create diversified arbitrage opportunities for projects with advanced forecasting and intelligent dispatch capabilities. In addition, as of January 1, 2026, Jiangsu officially implemented full market participation for all renewable electricity, making photovoltaic-plus-storage integration a necessity for smoothing output profiles and enhancing market-based revenues. During the critical winter peak demand period, user-side storage projects could also participate in demand response programs, earning peak-shaving compensation of up to RMB 4.8/kWh, significantly improving short-term revenue certainty and incentivizing projects to connect to the grid within the policy window.
On the demand side, structural factors continued to underpin market growth. January marked the winter peak electricity demand season in Jiangsu. On January 20, the province’s maximum load reached 135 GW, a new winter record and the highest nationwide for six consecutive years. Grid balancing and supply security pressures highlighted the system value of user-side storage. As a major manufacturing province with a high concentration of energy-intensive industries, Jiangsu faces strong demand for peak shaving, valley filling, and demand charge optimization. In January, peak–valley price spreads remained above RMB 0.6/kWh, supporting stable combined returns from energy arbitrage and demand management. Moreover, Jiangsu’s large installed base of distributed photovoltaics further amplified demand for storage, as pairing PV with storage under full market participation policies enables off-peak discharge and enhances project economics.
From a market structure perspective, growth in Jiangsu exhibited clear characteristics of scale and concentration. In January, several large projects—such as the 300 MWh user-side energy storage project of Jiangsu Huiran Industrial Co., Ltd.—along with multiple projects exceeding 5 MW / 40 MWh, were commissioned. Large-capacity projects accounted for the majority of additions, reinforcing Jiangsu’s “fewer projects, higher capacity” market profile. In addition, Jiangsu benefits from a well-developed local energy storage industrial chain. Through full-chain coordination, economies of scale, resource sharing, technology reuse, and business model innovation, system-level costs—including initial investment, operations, and lifecycle costs—can be significantly reduced, providing a strong industrial foundation for continued user-side market growth.
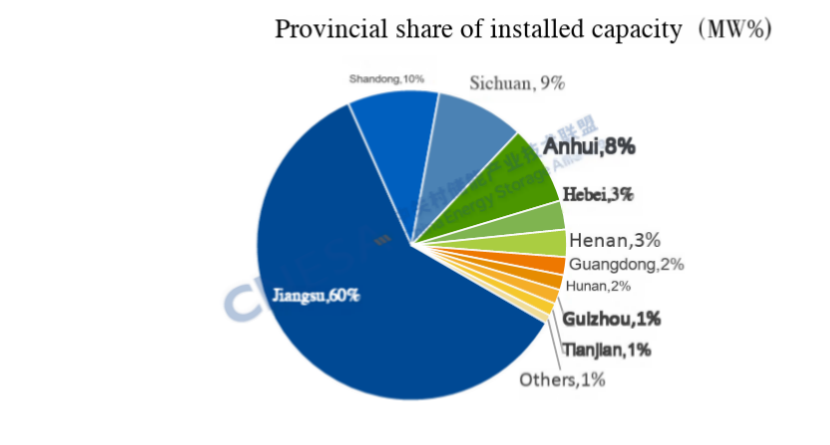
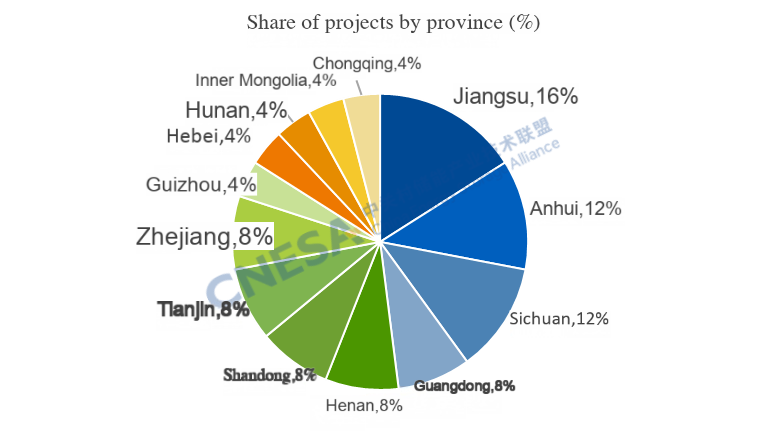
Figure 2. Provincial distribution of newly commissioned user-side new energy storage projects in January 2026
Source: CNESA DataLink
(3) Project Filings
From the perspective of project filings, January saw a “less but better” trend nationwide. The user-side market shifted from distributed expansion to scale and centralized development. The number of newly filed user-side projects fell by 38% year-on-year, while total filed capacity increased by 16%, and the average project size of single projects rose by 87%. In traditional markets, Jiangsu, Guangdong, and Zhejiang together added 321 new projects, down 42% year-on-year, while total energy capacity increased by 28%. Jiangsu recorded the largest total filed capacity, while Guangdong led in the number of newly filed projects. Over the past three years, Jiangsu has consistently seen year-on-year growth in both total filed capacity and average project size in January. This January, Jiangsu’s newly filed capacity rose 81% year-on-year, while project numbers declined 44%, resulting in an average project size roughly three times that of the same period last year—highlighting a clear trend toward larger individual projects. By contrast, Zhejiang continued to see declines in newly filed projects. In January, the number of projects fell 67% year-on-year, and total capacity declined 86%.
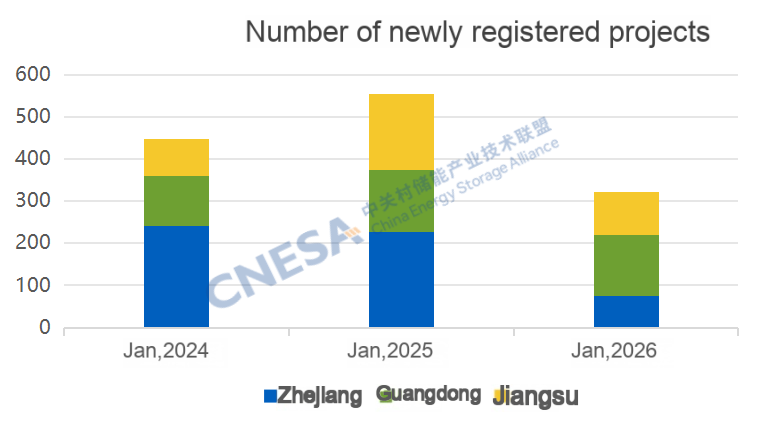
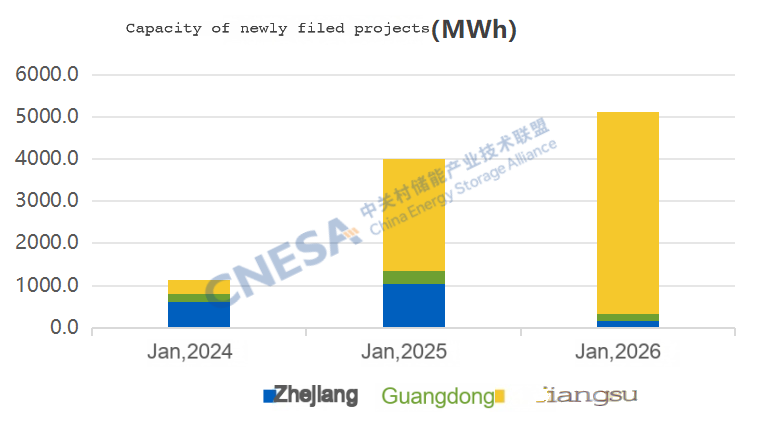
Figure 4. Newly filed energy storage projects in Zhejiang, Guangdong, and Jiangsu in January over the past three years
Source: CNESA DataLink
Overall Analysis of New Energy Storage Projects in January
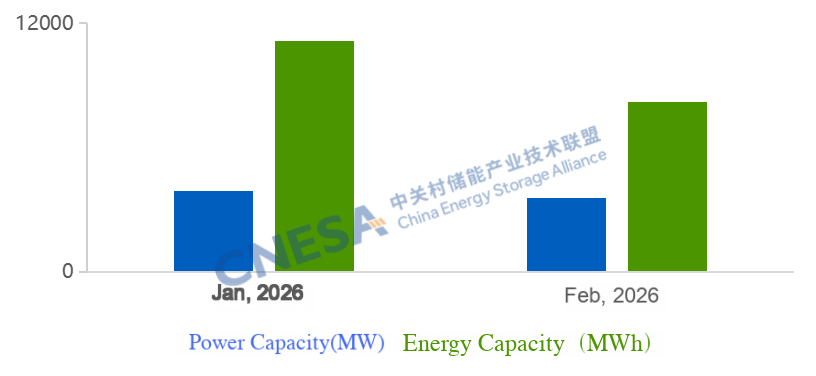
According to incomplete statistics from China Energy Storage Alliance (CNESA), total newly commissioned new energy storage capacity in China reached 3.78 GW / 10.90 GWh in January 2026, representing +62% / +106% year-on-year, but -84% / -86% month-on-month. Despite the sequential decline, year-on-year growth exceeded 60%, signaling a positive start to the year for the new energy storage market.
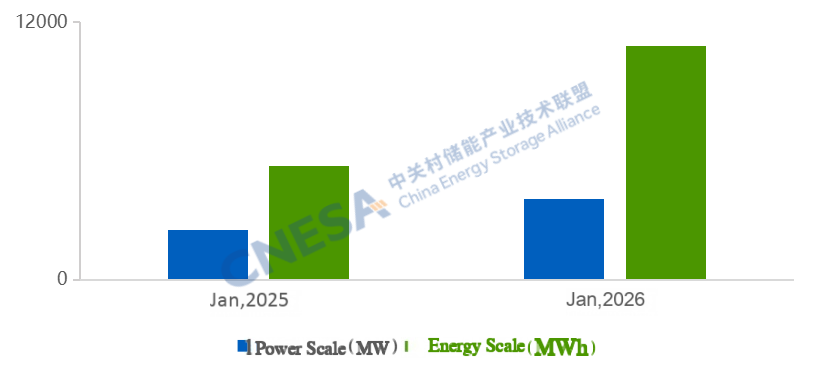
Figure 5. Newly commissioned new energy storage capacity in China in January 2026
Source: CNESA DataLink
Note: Year-on-year comparisons are based on the same period of the previous year; month-on-month comparisons are based on the immediately preceding period.
China Energy Storage Alliance adheres to standardized, timely, and comprehensive data collection methodologies to continuously track energy storage project developments. Leveraging long-term data accumulation and in-depth professional analysis, CNESA regularly publishes objective market analyses to support industry decision-making. Since June 2025, the Alliance’s monthly project analysis has been divided into two dedicated reports—Source-Grid-Side Market and User-Side Market. This issue focuses on the user-side market in January 2026.
For more comprehensive project information, authoritative data, and in-depth market insights, please visit www.esresearch.com.cn or access the CNESA DataLink mini program to explore detailed datasets and research reports. Customized data consulting services are also available through CNESA’s official support channels. CNESA is committed to providing full-cycle, high-quality data services for the industry.

At this critical juncture of diversified business model transformation for user-side energy storage, the ESIE 2026 will bring together leading enterprises from across the industry. The event will feature major launches of new C&I and residential storage products, alongside a series of high-level forums, including:Energy Storage Applications in Zero-Carbon Industrial Parks; Energy Storage + AIDC Collaborative Development;Energy Storage and Emerging Business Models;Distributed PV-plus-Storage;PV–Storage–Charging Integration;Overseas Energy Storage Project Development, Operation, and Practice;The Role and Value of Energy Storage in Virtual Power Plants.These sessions will provide in-depth analysis of market shifts and offer a one-stop platform spanning product showcases, operational best practices, and ecosystem collaboration. We cordially invite you to attend and explore pathways to breakthrough and growth in the evolving user-side energy storage landscape.
Register now to attend Asia’s Largest Energy Storage Trade Show for free:
What: The 14th Energy Storage International Conference & Expo
When: Conferences: March 31 - April 2, 2026
Exhibitions: April 1-3, 2026
Where: CIECC Beijing, China
Address: No. 55 Yudong road, Shunyi District, Beijing China

10.9 GWh! Newly Added New-Type Energy Storage Capacity in January Doubled Year-on-Year
China’s new-type energy storage market witnessed a strong start in January 2026. Newly commissioned capacity in January increased by over 60% year-on-year, while the market’s underlying structure showed notable adjustments compared with the same period last year.
China’s new-type energy storage market witnessed a strong start in January 2026. Newly commissioned capacity in January increased by over 60% year-on-year, while the market’s underlying structure showed notable adjustments compared with the same period last year.
A Strong Start to the Year: Newly added capacity: 3.8 GW / 10.9 GWh in January, representing a
year-on-year increase of 62% / 106%, marking a positive opening for the new-type energy storage
market.
Accelerated Deployment of Independent Energy Storage: In January, independent energy
storage accounted for nearly 90% of newly added capacity, up 41 percentage points year-on-
year. Newly added power and energy capacity of independent energy storage grew by over 240% /
290% year-on-year. Xinjiang ranked first nationwide in both power and energy capacity, with 1 GW
of newly commissioned independent energy storage.
Rise of Third-Party Enterprises: Third-party enterprises accounted for 45% of newly added
installed capacity, once again surpassing local energy groups and the “Big Five and Small Six”
state-owned power generation groups. The trend toward a diversified investment landscape has
become increasingly evident.
Accelerated Deployment of Diverse Technologies: Beyond mainstream lithium-ion batteries,
alternative technologies such as compressed air energy storage (CAES), flow batteries, and
flywheels are being deployed at a faster pace, supporting the industry’s long-term development.
Overall Analysis of New-Type Energy Storage Projects in January
According to incomplete statistics from the CNESA DataLink, in January 2026, newly commissioned new-type energy storage projects in China reached a total installed capacity of 3.78 GW / 10.90 GWh, representing year-on-year increases of 62% and 106%, respectively, and month-on-month declines of 84% and 86%. Monthly new added capacity growth exceeded 60% year-on-year, underscoring a positive market outlook at the beginning of the year.
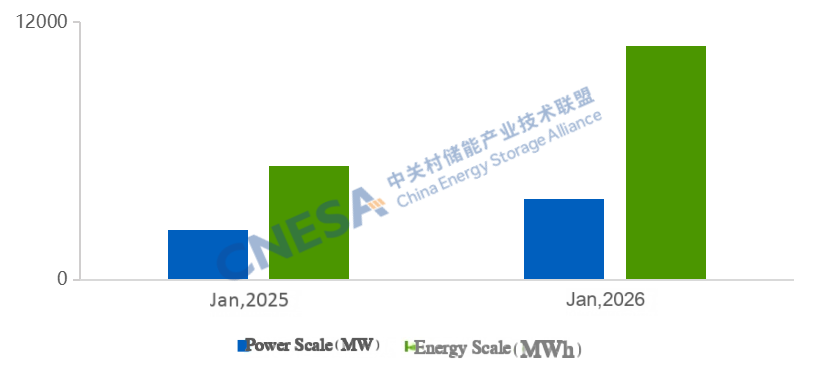
Figure 1: Installed Capacity of Newly Commissioned New-Type Energy Storage Projects in China, January 2026
Source: CNESA DataLink
Note: Year-on-year (YoY) comparisons are based on the same period of the previous year; month-on-month (MoM) comparisons are based on the immediately preceding statistical period.
Analysis of Generation- and Grid-Side New-Type Energy Storage Projects in January
In January, newly added generation- and grid-side new-type energy storage capacity reached 3.62 GW / 10.44 GWh, up 87% / 130% year-on-year, and down 84% / 87% month-on-month. Key characteristics include:
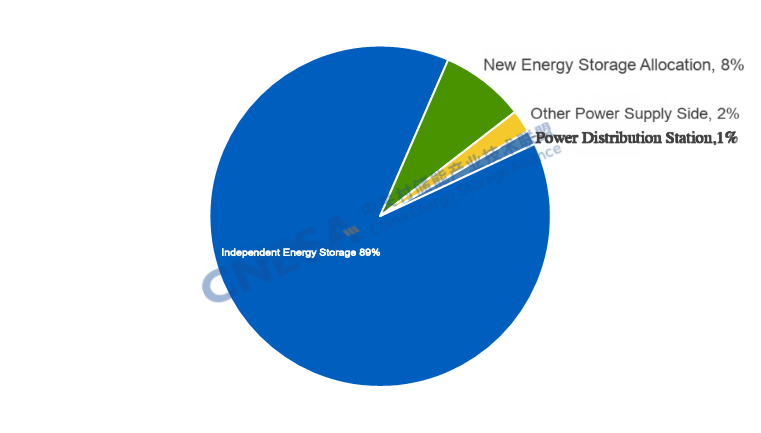
1.Independent energy storage accounted for 89% of new installations, up 41 percentage
points year-on-year and 12 percentage points month-on-month.
Newly added independent energy storage reached 3.2 GW / 9.6 GWh, up 249% / 298% year-on-year, and down 84%/87% month-on-month. The number of projects with capacities of 100 MW and above increased by 122% year-on-year, accounting for 85% of total projects—29 percentage points higher than the same period last year. By contrast, power-generation-side new-type energy storage additions were 366.5 MW / 740.3 MWh, down 64% / 65% year-on-year and 92% / 95% month-on-month. Among these, renewable-plus-storage projects accounted for 79% of power capacity, spanning diversified application scenarios such as desertification control, thermal–renewable–storage multi-energy integration, and hydro–solar–pumped storage integration.

Figure 2: Application Distribution of Newly Commissioned Generation- and Grid-Side New-Type Energy Storage Projects in January 2026 (MW%)
Source: CNESA DataLink
Note: “Others” include substations, emergency power supplies, etc.
2. Northwest China Accounted for Over 35% of New Capacity, with Xinjiang Leading
In January, the Northwest region ranked first nationwide, accounting for 35% of newly added capacity. Combined, the Northwest and North China regions contributed more than half of the national total. By province, Xinjiang recorded newly added capacity of 1.2 GW / 4.3 GWh, ranking first nationwide in both power and energy capacity.
By the end of January, Xinjiang’s installed renewable energy capacity exceeded 160 GW, accounting for 64% of the region’s total power capacity. Due to its distance from eastern and central load centers, Xinjiang has historically faced wind and solar curtailment challenges. In 2025, wind and solar utilization rates in Xinjiang were 91.0% and 86.3%, respectively—both below the national average. Growing pressure for renewable energy consumption and the need to mitigate grid fluctuations have driven large-scale deployment of new-type energy storage in the region. At the start of the year, several major projects were commissioned in quick succession, including the 500 MW / 2,000 MWh Ruoqiang energy storage project by Xinjiang Green Development Power, the 200 MW / 800 MWh grid-forming energy storage project by Huaneng Jingshun, and the 200 MW / 800 MWh energy storage project by LiXin Energy, demonstrating strong pilot and demonstration effects.
In terms of revenue mechanisms, Xinjiang has formed a relatively mature model combining capacity compensation, electricity energy trading, and ancillary services. On May 19, 2023, the Xinjiang Development and Reform Commission issued the Notice on Establishing and Improving Supporting Policies for the Healthy and Orderly Development of New-Type Energy Storage, introducing capacity compensation for grid-connected independent energy storage projectsand specified the implementation standards for 2023, 2024, and 2025, providing predictable early-stage policy support for independent energy storage projects in Xinjiang. . Although the original policy expired at the end of 2025, the clarification at the national level regarding capacity pricing mechanisms for grid-side independent energy storage is expected to lead to new local policies in Xinjiang, further improving long-term revenue certainty. With the rollout of ancillary service market rules in July 2025 and the transition of Xinjiang’s power spot market to continuous settlement trial operation, independent energy storage is expected to increasingly generate revenue through spot market arbitrage.
Moreover, Xinjiang has established a complete energy storage industry chain, covering batteries, PCS, BMS, and system integration. Large-scale manufacturing bases established by leading energy storage companies, together with local supply chains, have significantly reduced logistics and system integration costs, enhancing project economics. As grid upgrades and transmission channel construction progress, energy storage demand in Xinjiang is expected to be further released.
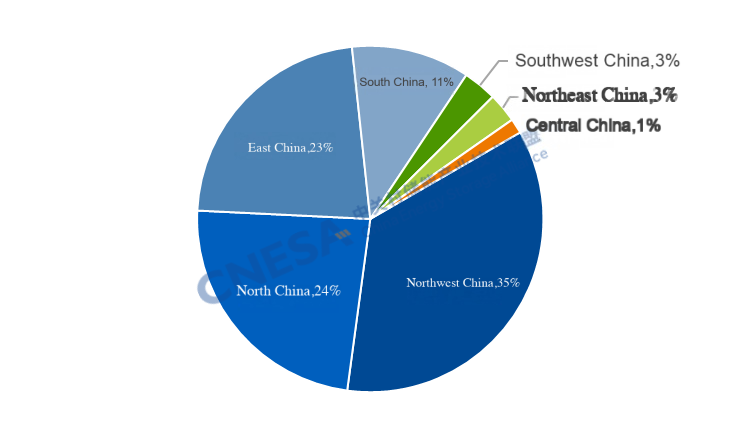
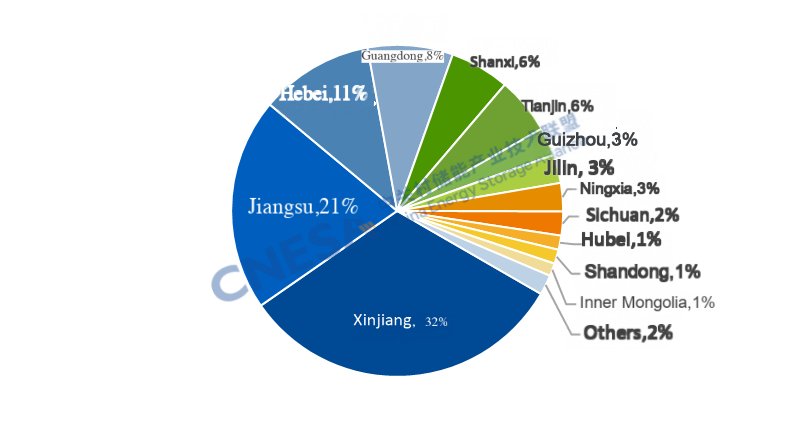
Figure 3: Regional Distribution of Newly Commissioned Generation- and Grid-Side New-Type Energy Storage Projects in January 2026 (MW%)
Figure 4: Provincial Distribution of Newly Commissioned Generation- and Grid-Side New-Type Energy Storage Projects in January 2026 (MW%)
Source: CNESA DataLink
3. Faster Deployment of Projects Invested by Third-Party Enterprises, the trend toward
diversification of energy storage investment entities has become increasingly evident.
In January, projects invested and developed by third-party enterprises—including China Green Development Group, Aerospace Hongji Energy Storage, and Daowei Energy Storage Group—were commissioned one after another. Third-party enterprises accounted for 45% of newly added installed power capacity, ranking first among all investor categories. Driven by rising market demand, supportive national policies, diversified technology pathways, and declining technology costs, the investment entity diversification trend became more pronounced in the first month of 2026.
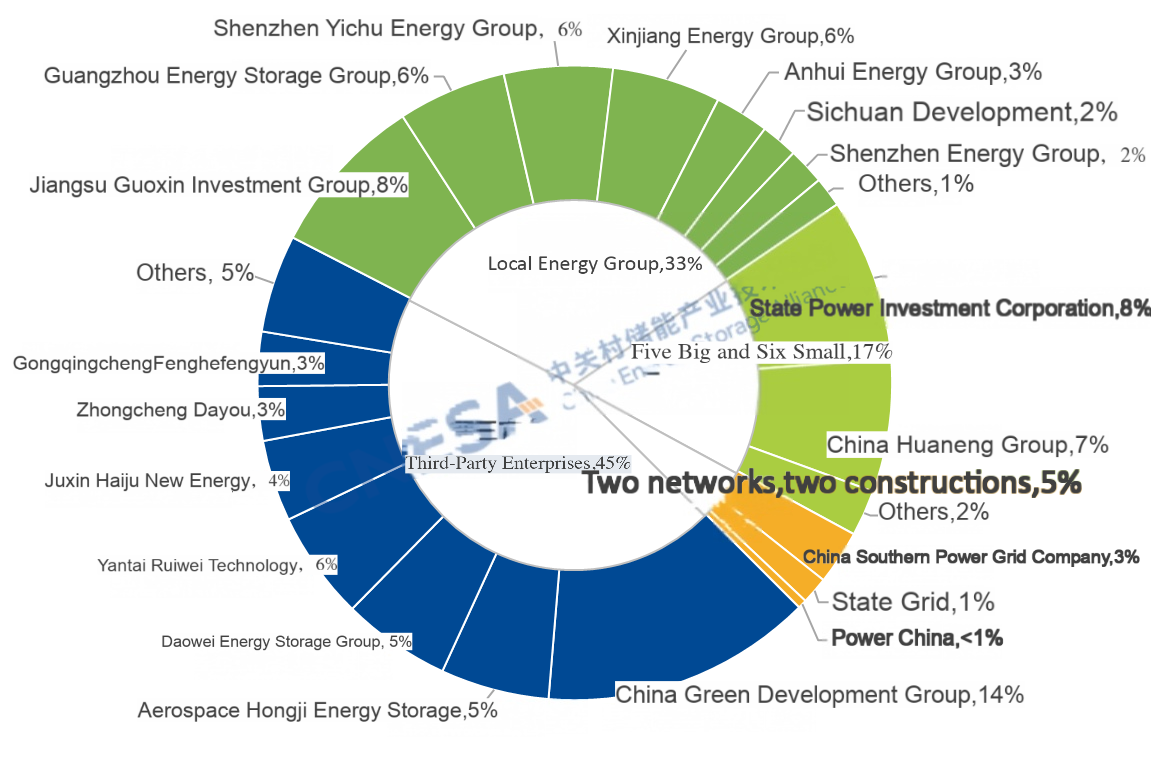
Figure 5: Owner Distribution of Newly Commissioned Generation- and Grid-Side New-Type Energy Storage Projects in January 2026 (MW%)
Source: CNESA DataLink Global Energy Storage Database
Note: Third-party enterprises refer to companies other than large state-owned power generation groups, the two major grid companies, their construction subsidiaries, and local energy groups.
4. Accelerated Deployment of Long-Duration Energy Storage Technologies
From a technology perspective, newly commissioned generation- and grid-side projects were dominated by lithium iron phosphate (LFP) batteries, accounting for 89% of installed power capacity, followed by compressed air energy storage (8%) and flow batteries (3%). Long-duration energy storage technologies—represented by CAES and flow batteries—as well as hybrid frequency regulation systems, are being deployed at an accelerating pace. Notable projects include the 300 MW Jiangsu Huai’an salt cavern CAES demonstration project, the Phase I Baicheng vanadium redox flow battery energy storage power station, and the Changyang Longzhouping vanadium redox flow battery energy storage project. In addition, a lithium battery + flywheel frequency regulation project by Shaanxi Energy was commissioned.
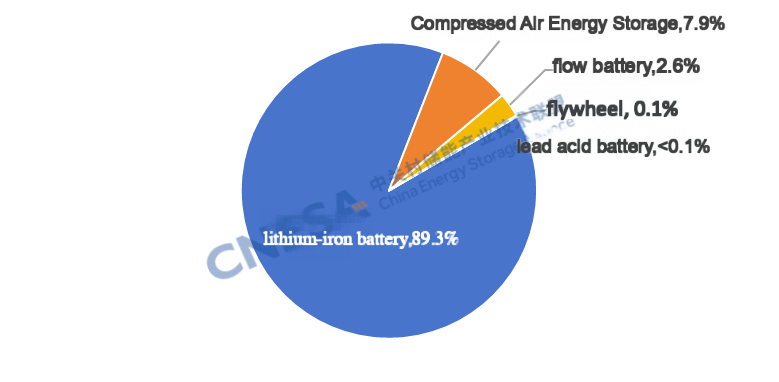
Figure 6: Technology Distribution of Newly Commissioned Generation- and Grid-Side New-Type Energy Storage Projects in January 2026 (MW%)
Source: CNESA DataLink
China Energy Storage Alliance (CNESA) continues to track energy storage project developments based on standardized, timely, and comprehensive data collection criteria. Leveraging long-term data accumulation and in-depth professional analysis, CNESA regularly publishes objective market analyses of energy storage installations, providing valuable references for industry decision-making. Since June 2025, CNESA’s monthly energy storage project analysis has been divided into generation- and grid-side and user-side market reports. This edition focuses on an in-depth interpretation of the generation- and grid-side market in January 2026.
For more comprehensive project information, authoritative data, and in-depth market analysis, please visit www.esresearch.com.cn or access the CNESA DataLink via the mini-program. For customized data consulting services, please contact CNESA through the official QR code. CNESA is committed to providing full-cycle, high-quality energy storage data services to industry stakeholders.

Register now to attend Asia’s Largest Energy Storage Trade Show for free:
What: The 14th Energy Storage International Conference & Expo
When: Conferences: March 31 - April 2, 2026
Exhibitions: April 1-3, 2026
Where: CIECC Beijing, China
Address: No. 55 Yudong road, Shunyi District, Beijing China

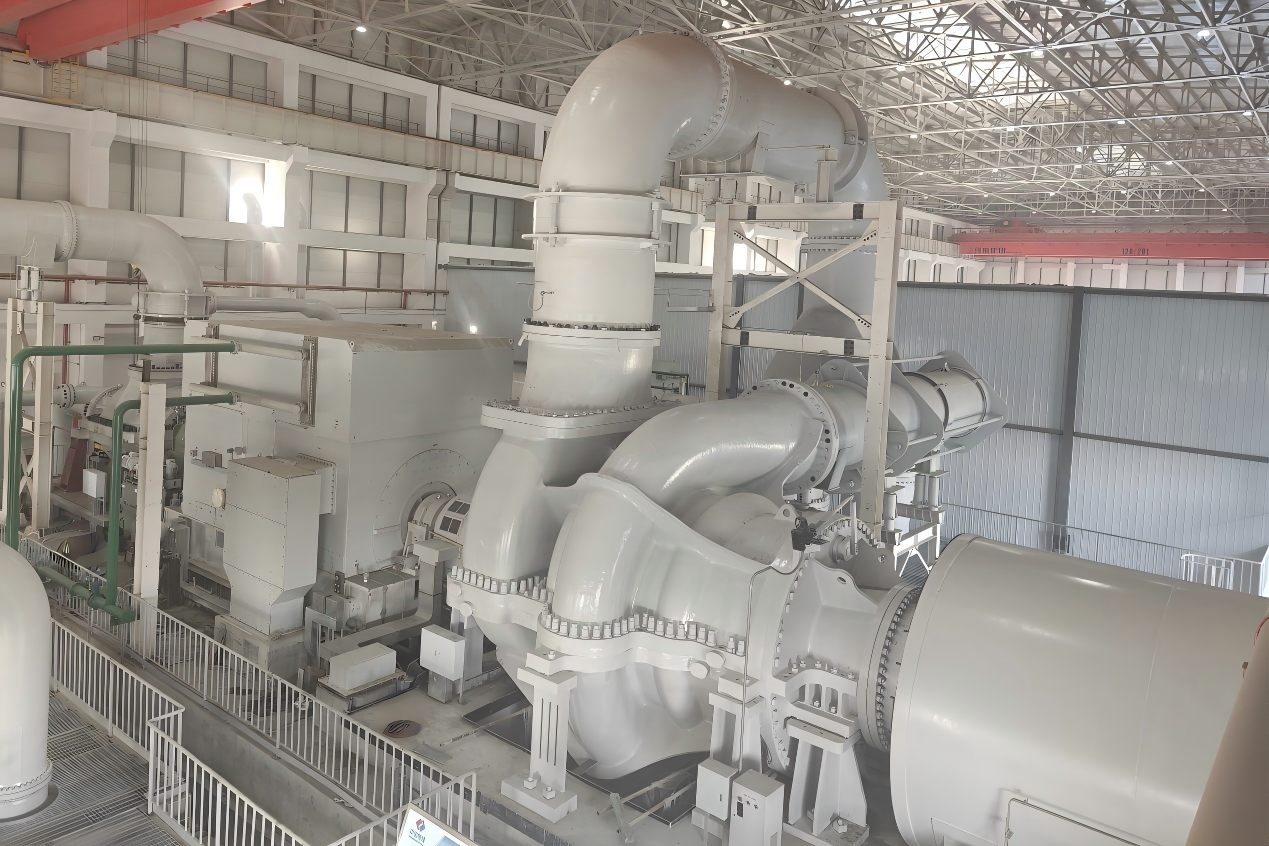
Major Breakthrough Achieved in the R&D of the World’s First and Most Powerful Single-Unit Compressed Air Energy Storage Compressor
Recently, China has achieved a major breakthrough in the research and development of compressed air energy storage(CAES) technology . Developed jointly by the Institute of Engineering Thermophysics, Chinese Academy of Sciences(IET, CAS) and ZHONG-CHU-GUO-NENG(BEIJING)TECHNOLOGY CO.,LTD., the world’s first CAES compressor with the largest single unit power has successfully passed the third-party testing accredited by CNAS. According to the test results, the compressor achieved maximum discharge pressure of 10.1MPa, a maximum power output of 101MW and an operating range of 38.7% to 118.4% under variable conditions and an efficiency of 88.1% at maximum discharge pressure, reaching an internationally leading level.
Recently, China has achieved a major breakthrough in the research and development of compressed air energy storage(CAES) technology . Developed jointly by the Institute of Engineering Thermophysics, Chinese Academy of Sciences(IET, CAS) and ZHONG-CHU-GUO-NENG(BEIJING)TECHNOLOGY CO.,LTD., the world’s first CAES compressor with the largest single unit power has successfully passed the third-party testing accredited by CNAS. According to the test results, the compressor achieved maximum discharge pressure of 10.1MPa, a maximum power output of 101MW and an operating range of 38.7% to 118.4% under variable conditions and an efficiency of 88.1% at maximum discharge pressure, reaching an internationally leading level.
The compressor is one of the most critical core components of a compressed air energy storage system. During the energy storage process, it will compress the atmospheric pressure air to high-pressure state and store it in gasometers, converting electric energy to pressure energy and thermal energy of the air. Through independent innovation, the research team overcame key technical challenges including overall system design and optimization, full 3-Dimensional flow optimization, long rotor complex shafting structure design and high-efficiency variable operating condition control, successfully developing the world’s first CAES compressor with a single unit power exceeding 100MW, featuring fully independent intellectual property rights. Compared with existing CAES compressors, its single-unit power has increased by more than 100%, unit costs have been significantly reduced and it offers advantages including high efficiency, high pressure and a wide operating range.
The Institute of Engineering Thermophysics, Chinese Academy of Sciences has been a pioneer in China’s CAES research since 2005. Through continuous efforts for over 20 years, it originally proposed new principles for advanced compressed air energy storage, developed several critical technologies including system design for full operating conditions system design, wide-load compressors, high-efficiency compact heat exchangers and high-load expanders; It has established a comprehensive R&D and design system covering “system design-key components-integrated control; it has also taken the lead in building national demonstration projects for 1.5MW-10MW-300MW advanced CAES. The successful development of the CAES marks an important milestone of world compressed air energy storage technology, which will drive the technology to a new level.
The above work was supported by projects including Chinese Academy of Sciences Strategic Priority Research Program (Category A), National Key Research and Development Program of China and National Natural Science Foundation of China (NSFC) Young Scientists Fund (Category A), among others .
Looking ahead, ZHONG-CHU-GUO-NENG will actively promote the application of this compressor and continue to enhance its capabilities in technological innovation, manufacturing, and engineering implementation. Through the transformation and wider application of major scientific and technological equipment achievements, the company aims to deliver high-end equipment with higher efficiency, better performance, and lower costs, thereby driving high-quality industrial development and supporting China’s energy transformation and sustainable development of regional economies.
Register now to attend Asia’s Largest Energy Storage Trade Show for free:
What: The 14th Energy Storage International Conference & Expo
When: Conferences: March 31 - April 2, 2026
Exhibitions: April 1-3, 2026
Where: CIECC Beijing, China
Address: No. 55 Yudong road, Shunyi District, Beijing China

Key Energy Storage Standards to Watch in 2026 Highly Recommended for Industry Reference
During the 14th Five-Year Plan period, China’s energy storage technology mix witnessed noticeable changes where pumped hydro storage accounted for less than 40% for the first time while the new-type energy storage represented by lithium batteries saw explosive growth.
During the 14th Five-Year Plan period, China’s energy storage technology mix witnessed noticeable changes where pumped hydro storage accounted for less than 40% for the first time while the new-type energy storage represented by lithium batteries saw explosive growth.
According to incomplete statistic from China Energy Storage Alliance (CNESA), by the end of 2025, China’s cumulative installed capacity of power storage reached 213.3GW among which pumped hydro storage shared 31.3% while the new-type cumulative energy installations represented by lithium battery accounted for over two thirds.
Against the backdrop of robust industry expansion, it is significant to improve energy storage standardization system especially enhancing safety standard.
Through the incomplete statistic, in 2025, China released over 40 national, industry and local standards on energy storage. These standards cover energy storage planning and designing, equipment testing, grid connection and operation, safety management and emergency response, providing important support to guide high-quality industry development, guarantee the safety of energy storage power stations, and promote the energy structure transformation and the green and low-carbon development across industrial value chain.
This article aims to clarify major energy storage standards released in 2025 and their influence. It will also list the key standards that have already come into force or will be implemented in 2026, helping industry stakeholder stay aligned with regulatory developments, mitigate compliance risks, and ensure the safe and efficient advancement of projects.
Strengthening the Energy Storage Safety Standards System From “Recommended” to “Mandatory”
Electrochemical Energy Storage represented by lithium battery has developed in a breakneck speed where installed capacity continued to expand, with safety being a core concern for the industry. In accordance with the incomplete statistic, 2025 alone saw about 30 energy storage safety accidents across the world. Two fires happened consecutively in American Moss Landing energy storage plant with huge loss, drawing widespread attention.
In order to ensure the safe and stable operation of lithium battery energy storage systems, cut down accident incidences and improve emergency response capabilities, the mandatory national standard GB 44240 Secondary lithium cells and batteries used in electrical energy storage systems—Safety requirements officially came into effect on August 1, 2025, which is recognized as the highest-level national standard on energy storage safety to date. It upgrades the safety requirements of energy storage lithium battery from “recommended” to “mandatory” for the first time, covering more than 20 rigorous testings from cell vibration, acceleration shock, shallow puncture, and compulsory discharge. Several leading companies’ battery products like those of CATL have passed third-party testings which is a sign that the standard’s entry into substantive implementation, setting a new benchmark for energy storage industry.
China’s Ministry of Housing and Urban-Rural Development released the revised national standard GB/T 51048- 2025 Design Standard for Electrochemical Energy Storage Power Station. Issued on December 31, 2025 and effective on April 1, 2026, this standard represents the first revision in a decade. Through revision across ten years, it introduces new technology pathways of sodium batteries, hydrogen fuel cells and so on. Based on practical challenges encountered during the application of electrochemical energy storage pathways over the past ten years, it established differentiated design requirements and addressing the potential safety risks serves as a core technical reference for the design of electrochemical energy storage power stations.
Shifting the Focus of Safety Protection from “Post-Incident Response” to “Pre-Incident Prevention”
With the continuous breakthroughs of safety protection technologies, shifting from “post-incident response” to “pre-incidence prevention” gradually become one of the major strategies.
China’s first national electrochemical energy storage fire warning standard GB/T 46261- 2025 General technical requirements for fire monitoring and warning systems for electrochemical energy storage stations was issued on August 29, 2025 and will take effect on September 1, 2026. This standard established a systematic and standardized framework for fire monitoring and early warning systems for the first time, covering several performances and technology requirements like multi-parameter monitoring, coordinated control and environmental adaptability and filling the long-standing gap in standards for early fire monitoring and warning product, which holds important reference for accident monitoring and safety warning system design in energy storage power stations.
CNESA standard Technical Specification for Liquid Nitrogen Fire Extinguishing Systems in Electrochemical Energy Storage Power Stations is currently under public consultation. Developed based on national key R&D program outcomes, the standard consolidates technical achievements in liquid nitrogen fire suppression systems and their application in protecting lithium-ion battery energy storage systems.
Internationally, the 2026 edition of NFPA 855 has also placed pre-incident prevention at the center of safety management. Systematic risk identification and mitigation analysis have been upgraded from conditional to routine requirements. It firstly introduced large-scale fire testings on the assessment of thermal runaway propagation. CSA/ANSI C800-2025 and the fifth edition of UL 9540A came as follows, which update large-scale fire testings requirements and significantly improve the proactive safety protection requirements of energy storage products.
Initial Progress Energy Storage Footprint Accounting Standards Supporting the “Dual Carbon” Goals
As the GB/T 24067- 2024 Greenhouse gases—Quantification methods and requirements for carbon footprint of product—Lithium-ion battery for electrical energy storage systems releases, China has built the foundational framework of carbon footprint accounting. Subsequently, the Ministry of Ecology and Environment together with National Development and Reform Commission and other authorities jointly issued the Guidelines for Developing Product Carbon Footprint Accounting Standards, encouraging broad participation in the design and amendment of product carbon footprint accounting standards. The guidelines target the formulation of 100 product carbon footprint standards by 2027 and 200 by 2030. Building on this framework, sector-specific carbon footprint standards are now gradually being developed.
In 2025, draft standards such as Greenhouse Gases—Product Carbon Footprint Quantification Requirements for Lithium-Ion Batteries Used in Electrical Energy Storage Systems, led by the China Electronics Standardization Institute, and Greenhouse Gases—Product Carbon Footprint Quantification Methods and Requirements for Lithium Battery Energy Storage Systems, jointly led by Shanghai Envision KES Technology Co., Ltd. and CNESA, entered the public consultation phase. Once released, these standards will provide clear and consistent methodologies for carbon footprint accounting for lithium-ion batteries and energy storage systems.
Conclusion
2025 marked an important year in the standardization of China’s energy storage sector with a set of critical safety standards releasing and implementing, providing essential guidance for the safe development of the industry. As energy storage technologies continue to develop and innovate, sustained collaboration among stakeholders and active participation in standardization efforts will remain critical to fostering a healthy energy ecosystem, supporting China;s energy transition, and advancing green and low-carbon development.
Appendix: Key Energy Storage Standards for 2026
Register now to attend Asia’s Largest Energy Storage Trade Show for free:
What: The 14th Energy Storage International Conference & Expo
When: Conferences: March 31 - April 2, 2026
Exhibitions: April 1-3, 2026
Where: CIECC Beijing, China
Address: No. 55 Yudong road, Shunyi District, Beijing China

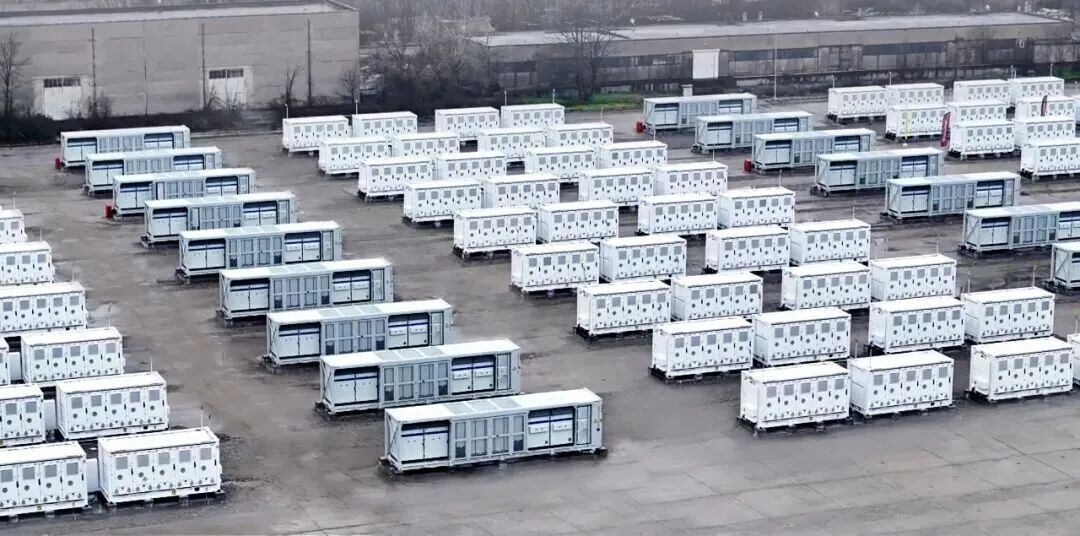
500MWh!BYD Energy Storage Has Commissioned Its Largest Energy Storage Project in East Europe
On January 8, 2026, a 500MWh standalone Battery Energy Storage System(BESS) project located at Maritsa East 3 in Bulgaria was officially commissioned. The project was the jointly developed by BYD Energy Storage and ContourGlobal under their strategic collaboration which is one of the largest standalone energy storage projects in East Europe.
On January 8, 2026, a 500MWh standalone Battery Energy Storage System(BESS) project located at Maritsa East 3 in Bulgaria was officially commissioned.
The project was the jointly developed by BYD Energy Storage and ContourGlobal under their strategic collaboration which is one of the largest standalone energy storage projects in East Europe. It is also BYD Energy Storage’s largest energy storage project in East Europe so far, fully demonstrating its technological capabilities and continued expansion of its global footprint. Since the cooperation agreement was signed in December, 2024, leveraging BYD Energy Storage’s own technological advantage together with CountourGlobal’s strong industry influence, the two parties have worked together to promote project deployment, laying solid foundation for long-term partnership, deeper penetration of the European market and enhanced brand presence in the Eastern European renewable energy sector.
BYD Energy Storage has confirmed its participation in the 14th Energy Storage International Conference and Expo(ESIE 2026), register now to attend Asia’s Largest Energy Storage Trade Show for free:
What: The 14th Energy Storage International Conference & Expo
When: Conferences: March 31 - April 2, 2026
Exhibitions: April 1-3, 2026
Where: CIECC Beijing, China
Address: No. 55 Yudong road, Shunyi District, Beijing China

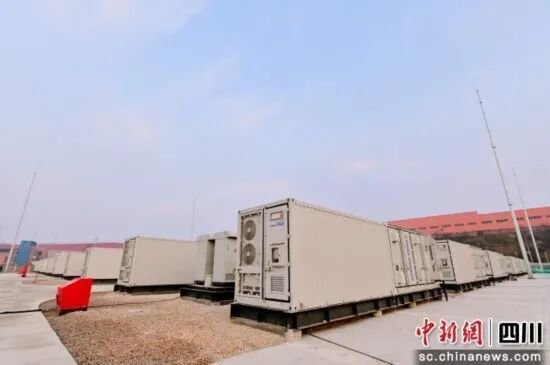
Annual Power Cost Savings Exceed RMB 60 Million ! Great Power’s 107MW/428MWh Hydropower-based Aluminium User-side Energy Storage Project is Commissioned
On January 16th, a 107.12MW/428.48MWh green hydropower-based aluminium user-side energy storage project jointly developed by Great Power and Henan Zhongfu Industry was officially commissioned in Guangyuan, Sichuan Province.
On January 16th, a 107.12MW/428.48MWh green hydropower-based aluminium user-side energy storage project jointly developed by Great Power and Henan Zhongfu Industry was officially commissioned in Guangyuan, Sichuan Province.
Designed and delivered under an EPC contract by Sichuan Zefeng Electric Power Design, the project achieved full-capacity grid connection by the end of 2025 after just five months of construction. It stands as a landmark project for green energy transformation in northern Sichuan and a benchmark case for energy-extensive industry implementing “source-grid-load-storage” integration.
Electricity stored at the facility is directly supplied to the electrolytic aluminium production system, primarily leveraging peak-valley electricity price arbitrage to reduce operating cost. According to estimates, the project is expected to lower electricity costs for electrolytic aluminum by approximately RMB 140 per tonne, delivering annual power cost savings of over RMB 60 million. Meanwhile, it will cut 52,000 tons carbon commission per year, providing a commercially viable solution to address high electricity costs and decarbonization pressures faced by energy-extensive industries.
Building on this project, the two partners will be committed to advance the development of a “zero-carbon aluminum industrial park” in Guangyuan. It plans to introduce advanced intelligent technology to build a virtual power plant (VPP) capable of engaging in power trading and grid dispatch. During the 15th Five-Year Plan period, the project developers will further expand the deployment of solar PV, wind power, green power direct supply and intelligent microgrids, ultimately establishing a safe and controllable regional intelligent micro-grid dominated by new energy, providing a practical model for developing a national new-type power system.
_______________________________________________
The Great Power has confirmed its participation in the 14th Energy Storage International Conference and Expo, register now to attend Asia’s Largest Energy Storage Trade Show for free:
What: The 14th Energy Storage International Conference & Expo
When: Conferences: March 31 - April 2, 2026
Exhibitions: April 1-3, 2026
Where: CIECC Beijing, China
Address: No. 55 Yudong road, Shunyi District, Beijing China

RMB 180 Billion! China Southern Power Grid Hit a New High for Investment in 2026
Expanding effective investment is a key lever for stabilizing growth and improving people’s livelihoods. According to China Southern Power Grid, the company has embarked RMB 180 billion for fixed-asset investment in 2026, marking a record high for fifth consecutive year, with an annual growth rate of 9.5%. Investment will be directed primarily toward the development of a new-type power system, the growth of strategic emerging industries and the enhancement of high-quality power supply services, providing solid support for a strong start to the 15th Five-Year Plan period.
Expanding effective investment is a key lever for stabilizing growth and improving people’s livelihoods. According to China Southern Power Grid, the company has embarked RMB 180 billion for fixed-asset investment in 2026, marking a record high for fifth consecutive year, with an annual growth rate of 9.5%. Investment will be directed primarily toward the development of a new-type power system, the growth of strategic emerging industries and the enhancement of high-quality power supply services, providing solid support for a strong start to the 15th Five-Year Plan period.
A strong start is decisive, and the opening moves sets the pace. China Southern Power Grid stays committed to the decisions and arrangements of the CPC Central Committee and the State Council, fully fulfilling its responsibilities as a centrally administered state-owned enterprise. Leveraging the power grid’s advantages-- large investment scale, long industrial chain, wide coverage, and strong spillover effects-- the company has expanded fixed-asset investment for five consecutive years. By appropriately advancing the deployment of energy and power infrastructure, it aims to better serve high-quality economic and social development.
Proactively serving the broader national agenda and fully advancing the implementation of major national strategies. China Southern Power Grid is actively supporting efforts to boost domestic consumption by using “two major” and “two new” projects to drive effective investment, and by advancing major projects under the “15th Five-Year Plan”. The company will intensify the renewal of grid infrastructure and digital and intelligent transformation with no less than RMB 50.6 billion to be invested in large-scale equipment renewal this year. To promote coordinated urban-rural regional development, the company will fully boost the construction of world-level bay area, advance power infrastructure development in Hainan ahead of demand and address weak links in grid facilities in Yunnan, Guizhou, and Guangxi. In Hainan, major projects including the 500kV offshore wind transmission are set to break ground this year, accelerating energy structure transformation and injecting strong momentum for Hainan Free Trade Port construction. In Guangxi, 220kV Weizhou Island cross-sea interconnection project has completed submarine cable laying and is scheduled to be commissioned in the first quarter of this year. In support of high-quality Belt and Road cooperation, thei China-Laos 500kV interconnection project is expected to be fully commissioned in the first half of the year.
Driving industrial upgrading and building a modern industrial system. China Southern Grid focuses on strengthening modern grid infrastructure, accelerate to built a backbone grid centered on flexible DC interconnections, intensify distribution network upgrades, and promote high-standard digital and intelligent grid planning and development. In Guangdong, the Guangzhou Tianhe Tangxia flexible DC project is scheduled to be commissioned by year-end. Using internationally leading multi-terminal flexible DC power interconnection control technology, the project will provide a new solution for reliable power supply to high-density load centers in mega-city grids. In Yunnan, the second interconnection project for Dulongjiang is planned to start construction in the first quarter, aiming to establish a demonstration zone for digital and intelligent microgrids. To foster and expand strategic emerging industries, China Southern Grid will accelerate the expansion and quality improvement of charging and battery-swapping infrastructure, strengthen the “Dianhong” ecosystem, and proactively deploy new frontiers such as marine energy and embodied intelligence. In Shenzhen, the largest vehicle-to-grid demonstration station in the Guangdong–Hong Kong–Macao Greater Bay Area will be commissioned in the first quarter, further accelerating the development of a “city of ultra-fast charging.” China Southern Grid will also promote high-quality and efficient power supply services by implementing a three-year action plan to improve power quality and launching targeted initiatives to enhance electricity services for people’s livelihoods. In Guizhou, power support projects for 610 clusters of rural wooden-house villages in the Qiandongnan Miao and Dong Autonomous Prefecture are scheduled to be fully completed and commissioned within the year.
Upholding dual-carbon goals and advancing “Two-Type” development. The company is supporting the high-quality development of renewable energy by coordinating large-scale development with high-level grid integration, enhancing the observability, controllability, and dispatchability of renewables, and improving intelligent dispatch and control capabilities. These efforts will support the addition of 40 million kilowatts of new renewable energy capacity this year. In Guangdong, the Yangjiang Sanshan Island offshore wind power flexible DC transmission project is more than halfway complete and is scheduled to be commissioned by year-end, delivering approximately 6 billion kWh of green electricity annually directly to the Guangdong–Hong Kong–Macao Greater Bay Area. To integrate into the national power productivity layout, construction of projects such as the Tibet–Guangdong DC transmission and Hunan–Guizhou flexible power interconnection is accelerating, facilitating the import of clean electricity from outside regions. CSG is also promoting the integrated development of electricity, carbon, and computing power, building new infrastructure that combines “power + computing,” upgrading the integrated operation platform, and advancing the development of a number of zero-carbon industrial parks and factories.
register now to attend Asia’s Largest Energy Storage Trade Show for free:
What: The 14th Energy Storage International Conference & Expo
When: Conferences: March 31 - April 2, 2026
Exhibitions: April 1-3, 2026
Where: CIECC Beijing, China
Adress: No. 55 Yudong road, Shunyi District, Beijing China

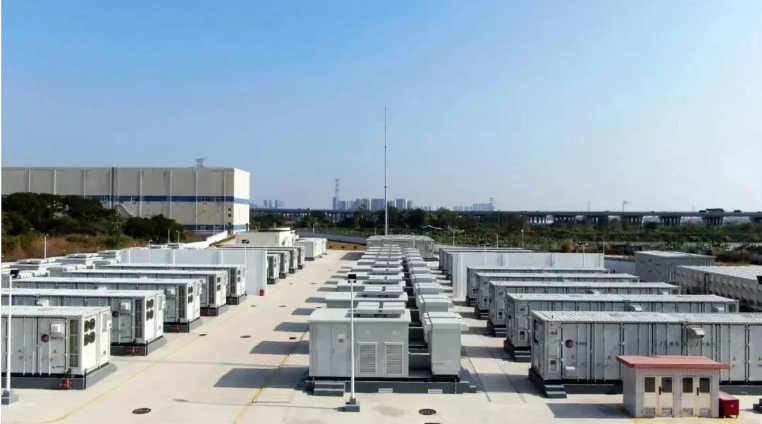
100MW/200MWh! Sineng Electric Supports Commissioning of Phase I of Nanlang Energy Storage Power Station
The Phase I 100MW/200MWh Nanlang energy storage power station, supplied by Sineng Electric, has now been successfully commissioned and put into operation. As the first large-scale standalone energy storage project on the grid side to be completed and commissioned in Zhongshan, China, the facility not only injects enhanced flexibility into the regional power grid, but establishes efficient and reliable revenue mechanism through an innovative frequency regulation service model.
The Phase I 100MW/200MWh Nanlang energy storage power station, supplied by Sineng Electric, has now been successfully commissioned and put into operation. As the first large-scale standalone energy storage project on the grid side to be completed and commissioned in Zhongshan, China, the facility not only injects enhanced flexibility into the regional power grid, but establishes efficient and reliable revenue mechanism through an innovative frequency regulation service model.
Grid-Forming Foundation, Intelligent Frequency Regulation
The project was invested in and developed by Shennan Dianxiwan (Zhongshan) Company, with Sineng Electric providing the core equipment, 1,250 kW centralized energy storage PCS units. The system is equipped with Sineng Electric’s second-generation enhanced hybrid grid-forming technology, incorporating globally leading IGBT drive technology and advanced intelligent control algorithms. As a result, the solution demonstrates significant advantages in three critical areas including response speed, command latency, and control accuracy, with its comprehensive frequency regulation performance index (K value) ranking among the best in the industry.
Since entering commercial operation six months ago, the power station has become an indispensable “gold-standard auxiliary service provider” for the regional grid. Supported by Sineng Electric’s energy storage PCS as the core equipment, the station has repeatedly delivered high-quality secondary frequency regulation services, effectively smoothing grid frequency fluctuations. The PCS offers flexible, on-demand adjustable ramp rates, reaching up to 50Pn/s, with a response time of ≤5 ms and a control accuracy error of no more than 0.5%. Much like a “speed stabilizer” for a high-speed power system, the solution significantly enhances the stability and reliability of electricity supply for thousands of households.
Sineng Electric has also confirmed its participation in the 14th Energy Storage International Conference and Expo (ESIE 2026), register now to attend Asia’s Largest Energy Storage Trade Show for free:
What: The 14th Energy Storage International Conference & Expo
When: Conferences: March 31 - April 2, 2026
Exhibitions: April 1-3, 2026
Where: CIECC Beijing, China
Address: No. 55 Yudong road, Shunyi District, Beijing China

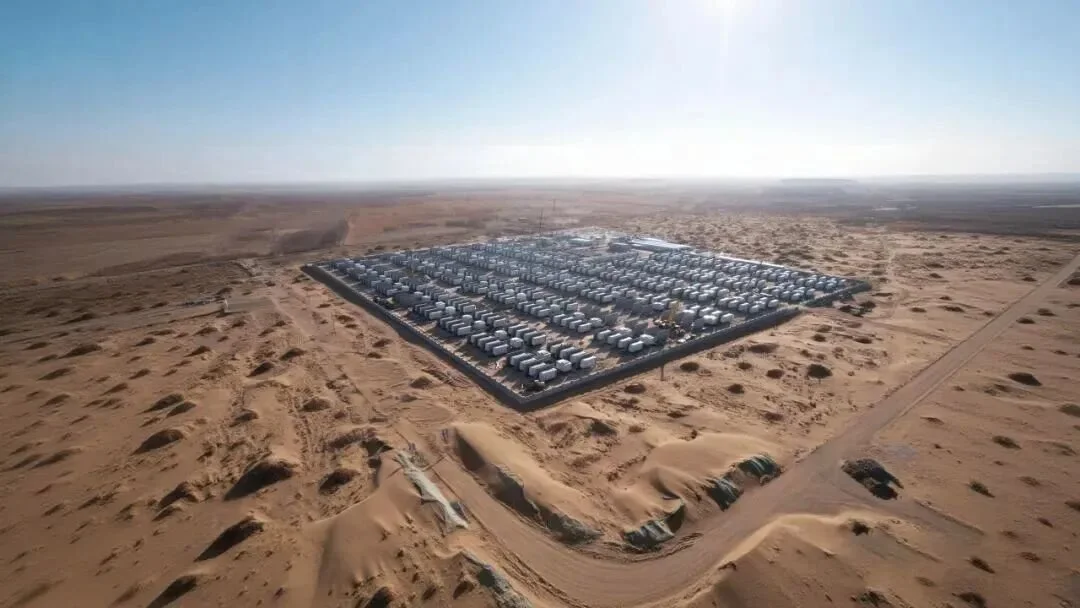
500MW/200MWh! JD Energy’s First GWh-Level Project Successfully Grid-Connected
In December 2025, the 500MW/2000MWh energy storage project was successfully grid-connected in Dengkou, Inner Mongolia. The energy storage station, standing proudly under the winter sun, is the first GWh-level project delivered by JD Energy. It not only set a new record for the scale of a single project but marked a significant milestone in the company’s development with its outstanding construction achievements.
In December 2025, the 500MW/2000MWh energy storage project was successfully grid-connected in Dengkou, Inner Mongolia. The energy storage station, standing proudly under the winter sun, is the first GWh-level project delivered by JD Energy. It not only set a new record for the scale of a single project but marked a significant milestone in the company’s development with its outstanding construction achievements.
01. 500MW/2000MWh: JD Energy enters the GWh-level project delivery
The 500MW/2000MWh energy storage project in Dengkou, Inner Mongolia, the first GWh-level project of JD Energy, utilized the company’s newly developed string-type prefabricated cabin, Galaxy-1. The project has an installed capacity of 500MW/2000MWh, deploying 400 units of Galaxy-1-4G and 100 units of eLink-HV35, a combined inverter and transformer.
In the harsh environment of sandstorms and cold temperatures, Galaxy-1 was used for the first time in a large-scale application on the grid-side. Despite the swirling yellow sands and biting winds, Galaxy-1 has laid a solid foundation for the new energy paradigm of Inner Mongolia with its exceptional environmental adaptability and operational stability.
02. Innovation empowerment: String-type prefabricated cabin Galaxy-1’s successful debut
The successful implementation of the 500MW/2000MWh energy storage project in Dengkou is driven by the flagship new product of JD Energy, the string-type prefabricated cabin Galaxy-1. This product adopts “All In One” design concept, integrating systems including 314Ah lithium iron phosphate (LiFePO4) batteries, BMS, string-type PCS, fire protection system, thermal management system, power distribution and communication system into a standard 20-foot container. It boasts key advantages of high efficiency, high safety and high integration. Through the successful practice of Dengkou project, Galaxy-1 made its debut on the grid-side, verifying its reliability and excellency in large-scale application.
With eMind-Trader as its core software system, JD Energy played a central role in supporting Dengkou power station’s operations from grid connection, market entry to autonomous participation in power trading, realizing a full value chain from system integration and project delivery to smart operation. This comprehensive technological advantage covering both hardware and software can not only significantly enhances the regional integration of new energy but also maximizes the project’s full lifecycle returns, achieving both stability and economic benefits.
03. Energizing the desert: green power driving regional development
At the turn of the year, Inner Mongolia has witnessed a surge in the grid connection of energy storage projects with energy constantly flowing. The successful grid connection of the 500MW/2000MWh energy storage project in Dengkou can effectively mitigate the fluctuations of intermittent renewable energy power generation of wind and solar power and significantly improve the grid’s adjustment capabilities and operational safety, providing more stable and higher-quality green electricity for Inner Mongolia and the North China region.
Meanwhile, the project will greatly increase the region’s ability to absorb renewable energy, reducing wind and solar curtailment. It will reinforce the energy transformation in Inner Mongolia and advance the national strategic goals of carbon peaking and carbon neutrality.
The successful grid connection of the 500MW/2000MWh energy storage project in Dengkou, Inner Mongolia marks JD Energy’s successful breakthrough in delivering a GWh-level single-project. It embodies the power of JD Energy with the debut of its flagship new product Galaxy-1. Moving forward, JD Energy will continue to innovate and explore energy storage sector, leaving a solid mark on the vast energy landscape while accelerating the progress of China’s energy revolution.
_______________________________________________________________
JD Energy has confirmed its participation of the 14th Energy Storage International Conference And Expo(ESIE 2026), register now to attend Asia’s Largest Energy Storage Trade Show for free:
What: The 14th Energy Storage International Conference & Expo
When: Conferences: March 31 - April 2, 2026
Exhibitions: April 1-3, 2026
Where: CIECC Beijing, China
Address: No. 55 Yudong road, Shunyi District, Beijing China

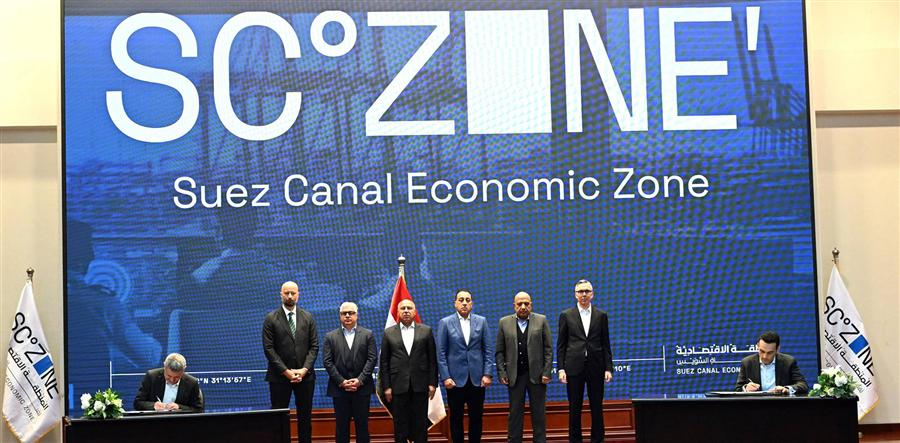
Sungrow’s First Energy Storage Plant in the Middle East Launched,with an Annual Capacity of 10 GWh
Egypt has taken a major step toward accelerating its clean energy transition, as Chinese energy storage leader Sungrow and Norwegian renewable developer Scatec partner with the Egyptian government to deliver large-scale solar+storage projects and establish the Middle East’s first battery energy storage manufacturing base, with a planned annual capacity of 10 GWh.
According to foreign media reports, the Egyptian government recently announced that it has signed a series of agreements worth over 1.8 billion USD with Norwegian renewable energy developer Scatec and Chinese energy storage company Sungrow. These agreements aim to build large-scale solar+storage projects and promote local manufacturing of battery energy storage systems. This series of agreements is a key initiative for Egypt to expand its clean energy installed capacity and improve its new energy industry chain.
Scatec will develop the “Energy Valley” project in Minya, which will include the construction of a large-scale integrated solar power and energy storage plant. Meanwhile, Sungrow will build a battery energy storage system manufacturing plant in the Suez Canal Economic Zone (SCZONE) to support energy storage equipment for the project and the regional market.
Both projects are being advanced with the coordination of Egyptian Ministry of Electricity and Renewable Energy and the Suez Canal Economic Zone Authority. Egyptian Prime Minister Mostafa Madbouly stated that these projects highly align with the country’s strategy of localizing new energy industries, and that localizing energy storage and renewable energy manufacturing will be key pillars for enhancing Egypt’s energy security and driving its green transformation.
As part of the project arrangements, the Egyptian Electricity Transmission Company (EETC) has signed a Power Purchase Agreement (PPA) with Scatec, while the New and Renewable Energy Authority (NREA) has signed a land use agreement for the Energy Valley project. Additionally, Sungrow has secured the land use rights for building the battery energy storage manufacturing plant in the TEDA Industrial Zone in SCZONE.
Furthermore, Scatec and Sungrow Energy have signed a battery supply contract, under which Sungrow Energy will provide the battery energy storage systems for the Energy Valley project in Minya.
According to the introduction, the Energy Valley project is positioned as one of the largest integrated clean energy projects in the world, and the first solar+storage project in the region capable of providing stable power supply around the clock. The project will build a 1.7 GW (AC) solar photovoltaic capacity, along with a total of 4 GWh of battery storage systems, distributed across Minya, Qena, and Alexandria. The project will also build new substations and dedicated transmission lines to provide clean electricity to the Wadi El-Sereiriya Industrial Zone in Minya.
On the manufacturing side, Sungrow Energy’s factory in Egypt will become the first battery energy storage system manufacturing base in the Middle East and Africa. Located in the TEDA-Egypt Industrial Zone in Ain Sokhna, the factory will cover an area of about 50,000 square meters and is expected to create around 150 direct jobs. Once operational, the factory will have an annual capacity of 10 GWh, with production expected to begin in April 2027.
Regarding financing, the Egyptian Prime Minister also witnessed the signing of preliminary financing agreements for the Energy Valley project between Scatec and the European Investment Bank (EIB), the European Bank for Reconstruction and Development (EBRD), and the African Development Bank (AfDB), marking the project’s support from multilateral development financial institutions.
__________________________________________________________________
Sungrow Energy has confirmed its sponsorship of the 14th Energy Storage International Conference and Expo (ESIE 2026), register now to attend Asia’s Largest Energy Storage Trade Show for free:
What: The 14th Energy Storage International Conference & Expo
When: Conferences: March 31 - April 2, 2026
Exhibitions: April 1-3, 2026
Where: CIECC Beijing, China
Address: No. 55 Yudong road, Shunyi District, Beijing China

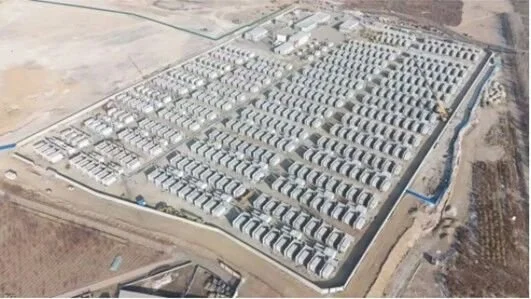
4.8 GWh Installed: Beijing KeRui Supports the Grid Connection of Two Major Grid-Side Energy Storage Projects in Inner Mongolia, Chi
In December 2025, two large-scale grid-side independent energy storage projects supported by Beijing KeRui were successfully connected to the grid in Inner Mongolia and put into operation: the 500 MW / 2,000 MWh Gushanliang project in Ordos and the 400 MW / 2,400 MWh Bu’erhantu project in Baotou.
In December 2025, two large-scale grid-side independent energy storage projects supported by Beijing KeRui were successfully connected to the grid in Inner Mongolia and put into operation: the 500 MW / 2,000 MWh Gushanliang project in Ordos and the 400 MW / 2,400 MWh Bu’erhantu project in Baotou.
Leveraging outstanding engineering execution capabilities, Beijing KeRui’s service team completed the entire process from installation to power delivery in just 50 days—an industry miracle that provided strong assurance for the high-quality and rapid commissioning of both projects. With a combined capacity of 4.8 GWh, the two projects set a new benchmark for the development of China’s independent energy storage sector in terms of large scale, high quality, and accelerated delivery. They inject strong momentum into regional energy structure transformation and provide critical support for building a stable and reliable new-type power system.
In these two flagship projects, Beijing KeRui’s integrated energy storage power conversion and step-up units served as the primary AC-side equipment and played a central role in successful commissioning. Several innovative technologies proved critical to project delivery:
Energy-Efficiency-Oriented Intelligent Thermal Management
The system adopts an innovative multi-tier thermal management strategy centered on “on-demand activation and load matching.” By dynamically aligning transformer cooling requirements with fan operating conditions, the design achieves optimal coordination between auxiliary power consumption and heat dissipation efficiency, significantly reducing unnecessary energy use. In addition, an intelligent heat-exchange buffering design adjusts fresh-air temperature seasonally—mitigating cold shock in winter to protect equipment and pre-cooling intake air in summer to enhance heat dissipation—thereby ensuring long-term stable operation while further refining overall energy efficiency.
Reinforced Structural Design with Integrated Drainage
Through optimization of the converter platform layout, the system enhances overall structural strength while naturally forming efficient drainage channels. This eliminates the need for additional drainage components, achieving dual functionality within a single structure and balancing structural safety with environmental adaptability. The design reflects a philosophy of simplicity, reliability, and efficiency.
Verified Transport Reliability
The equipment underwent rigorous transportation testing, including over 3,000 kilometers of highway transport and 450 kilometers of reinforced standard-condition road testing. These trials fully validated the system’s ability to withstand complex overland transportation challenges, ensuring structural integrity and stable performance throughout delivery and meeting the stringent requirements of real-world engineering logistics.
One notable highlight of the projects is the application of HyperStrong’s flagship large-capacity liquid-cooled energy storage system, representing the latest advancements in electrochemical energy storage technology. HyperStrong’s independently developed second-generation power conversion system (PCS) features advanced technology with fully independent and controllable core technologies. It can accurately respond to grid dispatch requirements and, through customized design, adapts effectively to complex operating conditions to ensure safe and stable year-round operation. This PCS has been successfully integrated into Beijing KeRui’s integrated unit solution.
Another key highlight is the adoption of CATL’s advanced 587 Ah energy storage cells, which achieve an energy density of 434 Wh/L, a cycle efficiency of up to 96.5%, and further optimized cycle life and degradation performance. This marks the first time Beijing KeRui’s integrated power conversion and step-up system has been deployed in combination with this cell model, demonstrating the company’s rapid response capability in adopting cutting-edge technologies and integrating high-performance components. Beijing KeRui’s integrated design deeply combines core modules—including the power conversion system, step-up transformer, power distribution switchgear, intelligent control, fire protection and security, and thermal management—into a single solution. Through optimized structural topology and layered spatial design, the capacity of a single box-type dry transformer can be increased to over 8,250 kVA, unlocking substantial energy output within limited space. This approach reduces land-use costs while enabling flexible deployment across diverse application scenarios.
The commissioning of the two energy storage power stations will significantly enhance the Inner Mongolia power grid’s ability to accommodate variable renewable energy sources such as wind and photovoltaic power. The projects will effectively smooth peak–valley load differences, improve grid flexibility, and strengthen overall system security and stability. Looking ahead, leveraging the comprehensive advantages of its integrated energy storage power conversion and step-up units—spanning energy efficiency, structural optimization, reliability, and adaptability—Beijing KeRui will continue to provide high-performance, high-reliability energy storage system solutions. The company aims to help customers achieve lower operating costs, higher full life-cycle discharge returns, and improved investment performance.
As an active participant and key driver in the development of new-type power systems, Beijing KeRui remains committed to advancing clean and low-carbon energy transition through technological innovation and superior service, contributing to a safer, more efficient, and greener modern energy system.
Register now to attend Asia’s Largest Energy Storage Trade Show for free:
What: The 14th Energy Storage International Conference & Expo
When: Conferences: March 31 - April 2, 2026
Exhibitions: April 1-3, 2026
Where: CIECC Beijing, China
Address: No. 55 Yudong road, Shunyi District, Beijing China

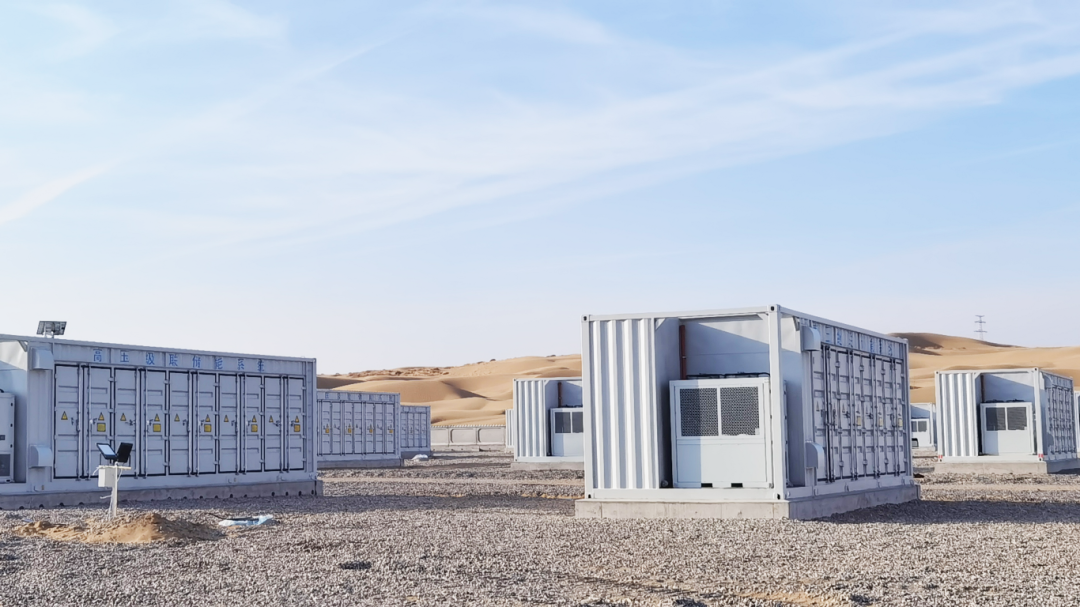
China Mingyang Longyuan’s First 100MW/400MWh High-Voltage Cascade Independent Energy Storage Project Achieves Full-Capacity Grid Connection
Mingyang Longyuan has built a major milestone in China’s energy storage sector with the successful full-capacity grid connection of its first 100MW/400MWh high-voltage cascade independent energy storage project in Ordos, Inner Mongolia. The project’s commissioning highlights the company’s technological strength in large-scale, high-efficiency, and highly reliable energy storage solutions, while reinforcing the critical role of advanced storage systems in supporting grid stability and renewable energy integration.
On December 28, Mingyang Longyuan’s first 100MW/400MWh high-voltage cascade independent energy storage project, the Yashitu Power Station, successfully achieved full-capacity grid connection at the Gushanliang site in Ordos, China. The project also passed the “three charge and three discharge” test of the West Inner Mongolia Power Grid and has officially entered commercial operation.
As an optimal solution for large-scale energy storage power stations, Mingyang Longyuan’s high-voltage cascade energy storage system demonstrates significant advantages, including large unit capacity, high energy conversion efficiency, enhanced safety performance, lower overall system cost, simplified coordinated control, and extended battery lifespan. The system also provides strong grid-support capabilities, enabling reliable performance under complex conditions such as extreme temperature variations and high humidity, while effectively supporting peak shaving, frequency regulation, and large-scale integration of renewable energy.
The project has achieved a long-duration cycle efficiency exceeding 90 percent, marking a substantial breakthrough in key performance indicators. This achievement reflects the sustained efforts of Mingyang Longyuan’s R&D and service teams. Despite harsh construction conditions characterized by strong winds, heavy snowfall, and extremely low temperatures in Ordos, the team overcame multiple technical challenges through continuous on-site work, ensuring the project’s timely commissioning. The experience gained has further strengthened the company’s capabilities in operating energy storage systems under extreme environmental conditions, laying a solid foundation for long-term stable and reliable performance.
The successful commissioning of the Gushanliang energy storage power station in Ordos underscores Mingyang Longyuan’s technical strength and product reliability, representing an important milestone in the company’s continued expansion in the energy storage sector. Looking ahead, Mingyang Longyuan will remain driven by technological innovation, advancing the upgrading of the energy storage industry and contributing to the development of a clean, low-carbon, safe, and efficient energy system.
——————————————————————————————————————————————————
Register now to attend Asia's Largest Energy Storage Trade Show for free:
What: The 14th Energy Storage International Conference & Expo
When: Conferences: March 31 - April 2, 2026
Exhibitions: April 1-3, 2026
Where: CIECC Beijing, China
Address: No. 55 Yudong road, Shunyi District, Beijing China

Google Acquires U.S. Energy Storage Giant for $4.75 Billion
As the global tech giants engage in a frenzied race for AI computing power, a more fundamental battle over “energy supply” is unveiling. Google’s multi-billion dollar power play procured not just an energy storage company but the the “electricity passport” towards the AI-driven future.
I. Blockbuster Acquisition: Acquisition of U.S. Energy Storage Giant for $4.75 Billion
On December 22, Alphabet, Google's parent company, announced that it will acquire Intersect Power, a leading U.S. battery energy storage system developer and operator, for $4.75 billion in cash plus the assumption of debt.
What to watch:
Targeted Assets: The acquisition does not cover the already operational assets but targets its future clean energy power generation projects, data center and energy storage system, totaling 10GWh.
Strategic intention: directly circumvent the crowded traditional grid and build an exclusive “power generation + energy storage” closed loop for AI data center.
The Alphabet CEO said: “ Intersect will help us synchronize the creation of power generation and energy storage system so as to match the added data center load and reshape energy solutions of AI data center.
II. Urgency: The high energy consumption “black hole” of AI data center
It is the tremendous energy pressure alongside generative AI behind the acquisition.
Surge in electricity consumption: the electricity demand is estimated to grow manyfold of data center hubs including State of Texas and California in 2030.
Stringent Reliability requirement: The AI data center requires 99.999% power supply reliability, which is hard to satisfy for traditional grid.
Solutions: Battery Energy Storage System emerges as the key infrastructure to balance the intermittency of renewable energy and achieve 24/7 uninterrupted power supply.
III. Ecological Synergy: Tesla makes an indirect play and broaden the collaboration zone
It is noteworthy that Intersect and Tesla are long-term collaboration partners. Google’s move means Tesla will step into the collaboration zone.
Current collaboration: Many operational energy storage projects of Intersect have employed the Megapack energy storage system of Tesla (like the Oberon 1 GWh project of California)
A huge order: Intersect also signed the 15.3GWh supply contract with Tesla, becoming one of the world’s largest purchasers and operators of this model of energy storage equipment.
IV. Chinese Companies: A head start in the Global data center energy storage arena
In fact, China’s top-tier energy storage companies have identified the opportunities early on, actively expanding their presence in the global “data center + energy storage” sector:
Companies like SUNGROW, SHUANGDENG, HUAWEI, KWLONG, ZTT, NARADA, HTHIUM, ROBESTEC, Potis Edge, Ampace, CLOU, Hopewind, CHNT, KSTAR, Vertiv, DELTA, EATON, VISION, SINEXCEL, JST(JINPAN TECHNOLOGY), TONGFEI, Envicool, Goaland, Shenling, HAIWU and so on has played their respective roles engaging in data center energy construction.
The market demonstrates that China’s supply chain ranging from power sources, battery to management system is becoming an important power to underpin the global AI data center energy transformation.
V. Industry Barometer: the summit forum focuses on “data center + energy storage” future
Google’s acquisition does not stand alone and it points to a global trend: energy storage combined with data center has become the central arena where global technology and energy industry converge.
This trend will be fully represented in the upcoming industry grand.
_____________________________________________________________________________________________
Register now to attend Asia's Largest Energy Storage Trade Show for free:
What: The 14th Energy Storage International Conference & Expo
When: Conferences: March 31 - April 2, 2026
Exhibitions: April 1-3, 2026
Where: CIECC Beijing, China
Address: No. 55 Yudong road, Shunyi District, Beijing China

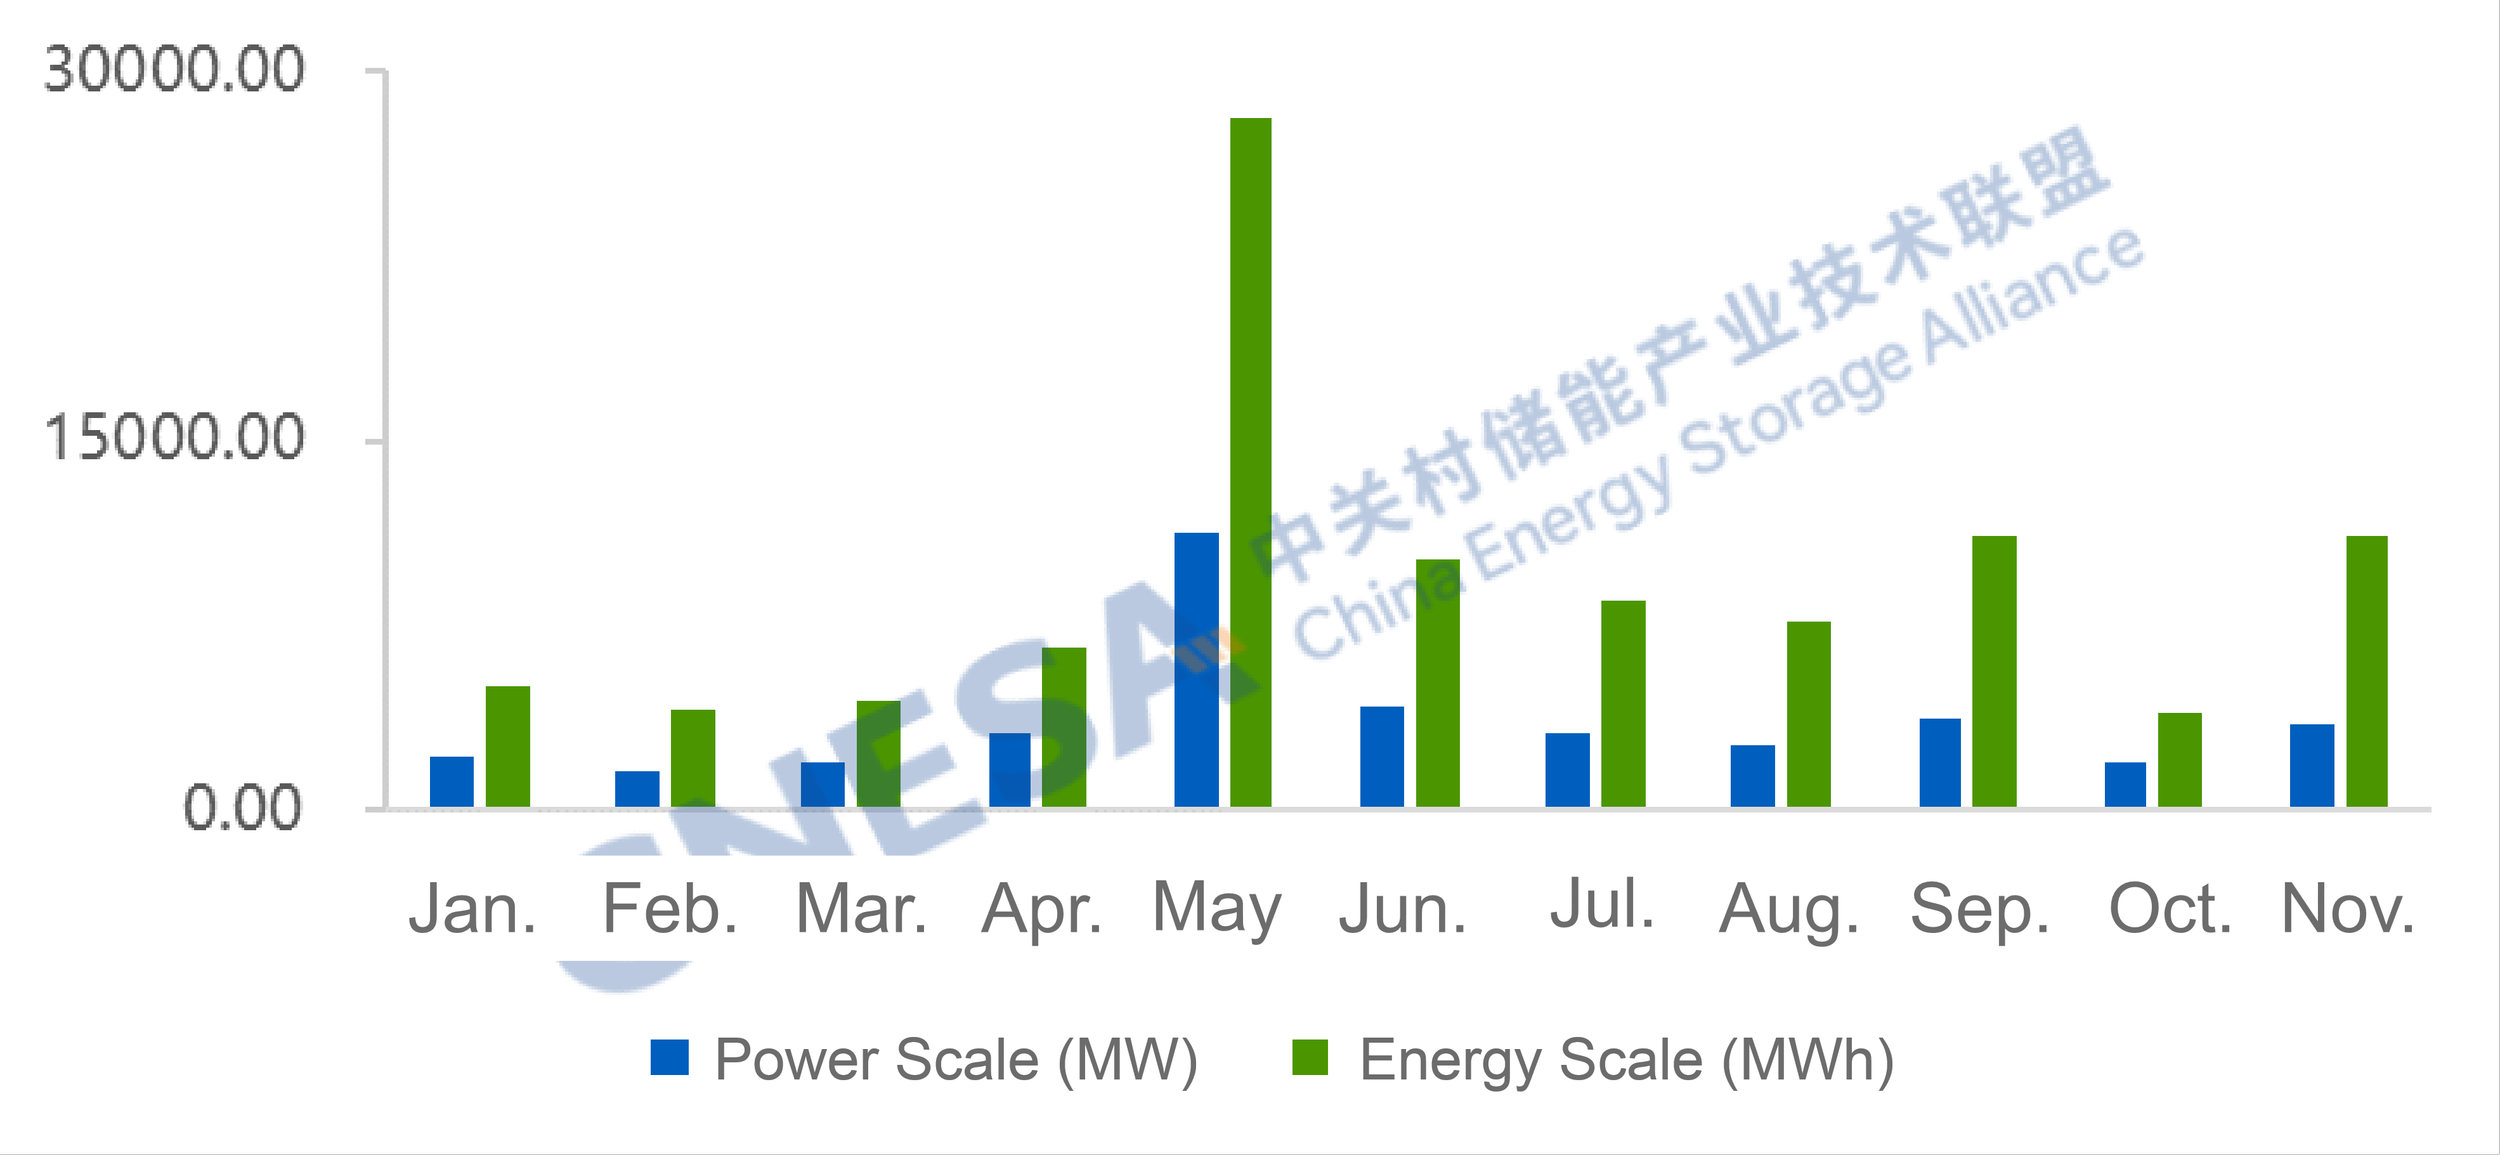
New Installations Down 67% YoY: Analysis of China's User-Side New Energy Storage Projects in November
Source: CNESA
In November 2025, newly installed user-side new energy storage capacity in China recorded a year-on-year decline of over 65%.
Compared with October, the market structure showed notable adjustments:
Commercial and industrial (C&I) energy storage accounted for nearly 90%, while long-duration energy storage technologies accelerated deployment.
East China contributed more than half of newly commissioned capacity, with Fujian leading in installed capacity.
Although filing activity in traditional user-side markets (Zhejiang, Guangdong, Jiangsu) declined compared with the same period last year, overall demand remained higher year-on-year. Emerging markets such as Anhui, Henan, and Sichuan are becoming new growth engines driving the national user-side energy storage market.
Analysis of User-Side New Energy Storage Projects in November
In November, newly installed user-side capacity reached 185.27 MW / 555.83 MWh, representing -67% / -57% year-on-year, and -5% / +16% month-on-month. User-side new energy storage projects exhibited the following characteristics:
(1) Installed Capacity by Application
In November, the user-side energy storage market continued to be dominated by C&I applications, accounting for nearly 90% of total installations. Newly installed C&I capacity reached 163.9 MW / 541.3 MWh, -68% / -58% year-on-year, and -9% / +15% month-on-month.
The largest data center user-side energy storage project in Zhejiang was officially commissioned. Rapid development of AI data centers (AIDC) and intelligent computing centers is driving growth in user-side energy storage demand.
From a technology perspective, all newly commissioned projects adopted electrochemical energy storage technologies. Lithium iron phosphate (LFP) batteries accounted for over 99% of installed power capacity. In terms of long-duration storage, one 8-hour, 202 MWh lithium-based C&I energy storage project and one 8-hour, 2 MWh all-vanadium redox flow battery project were completed and put into operation.
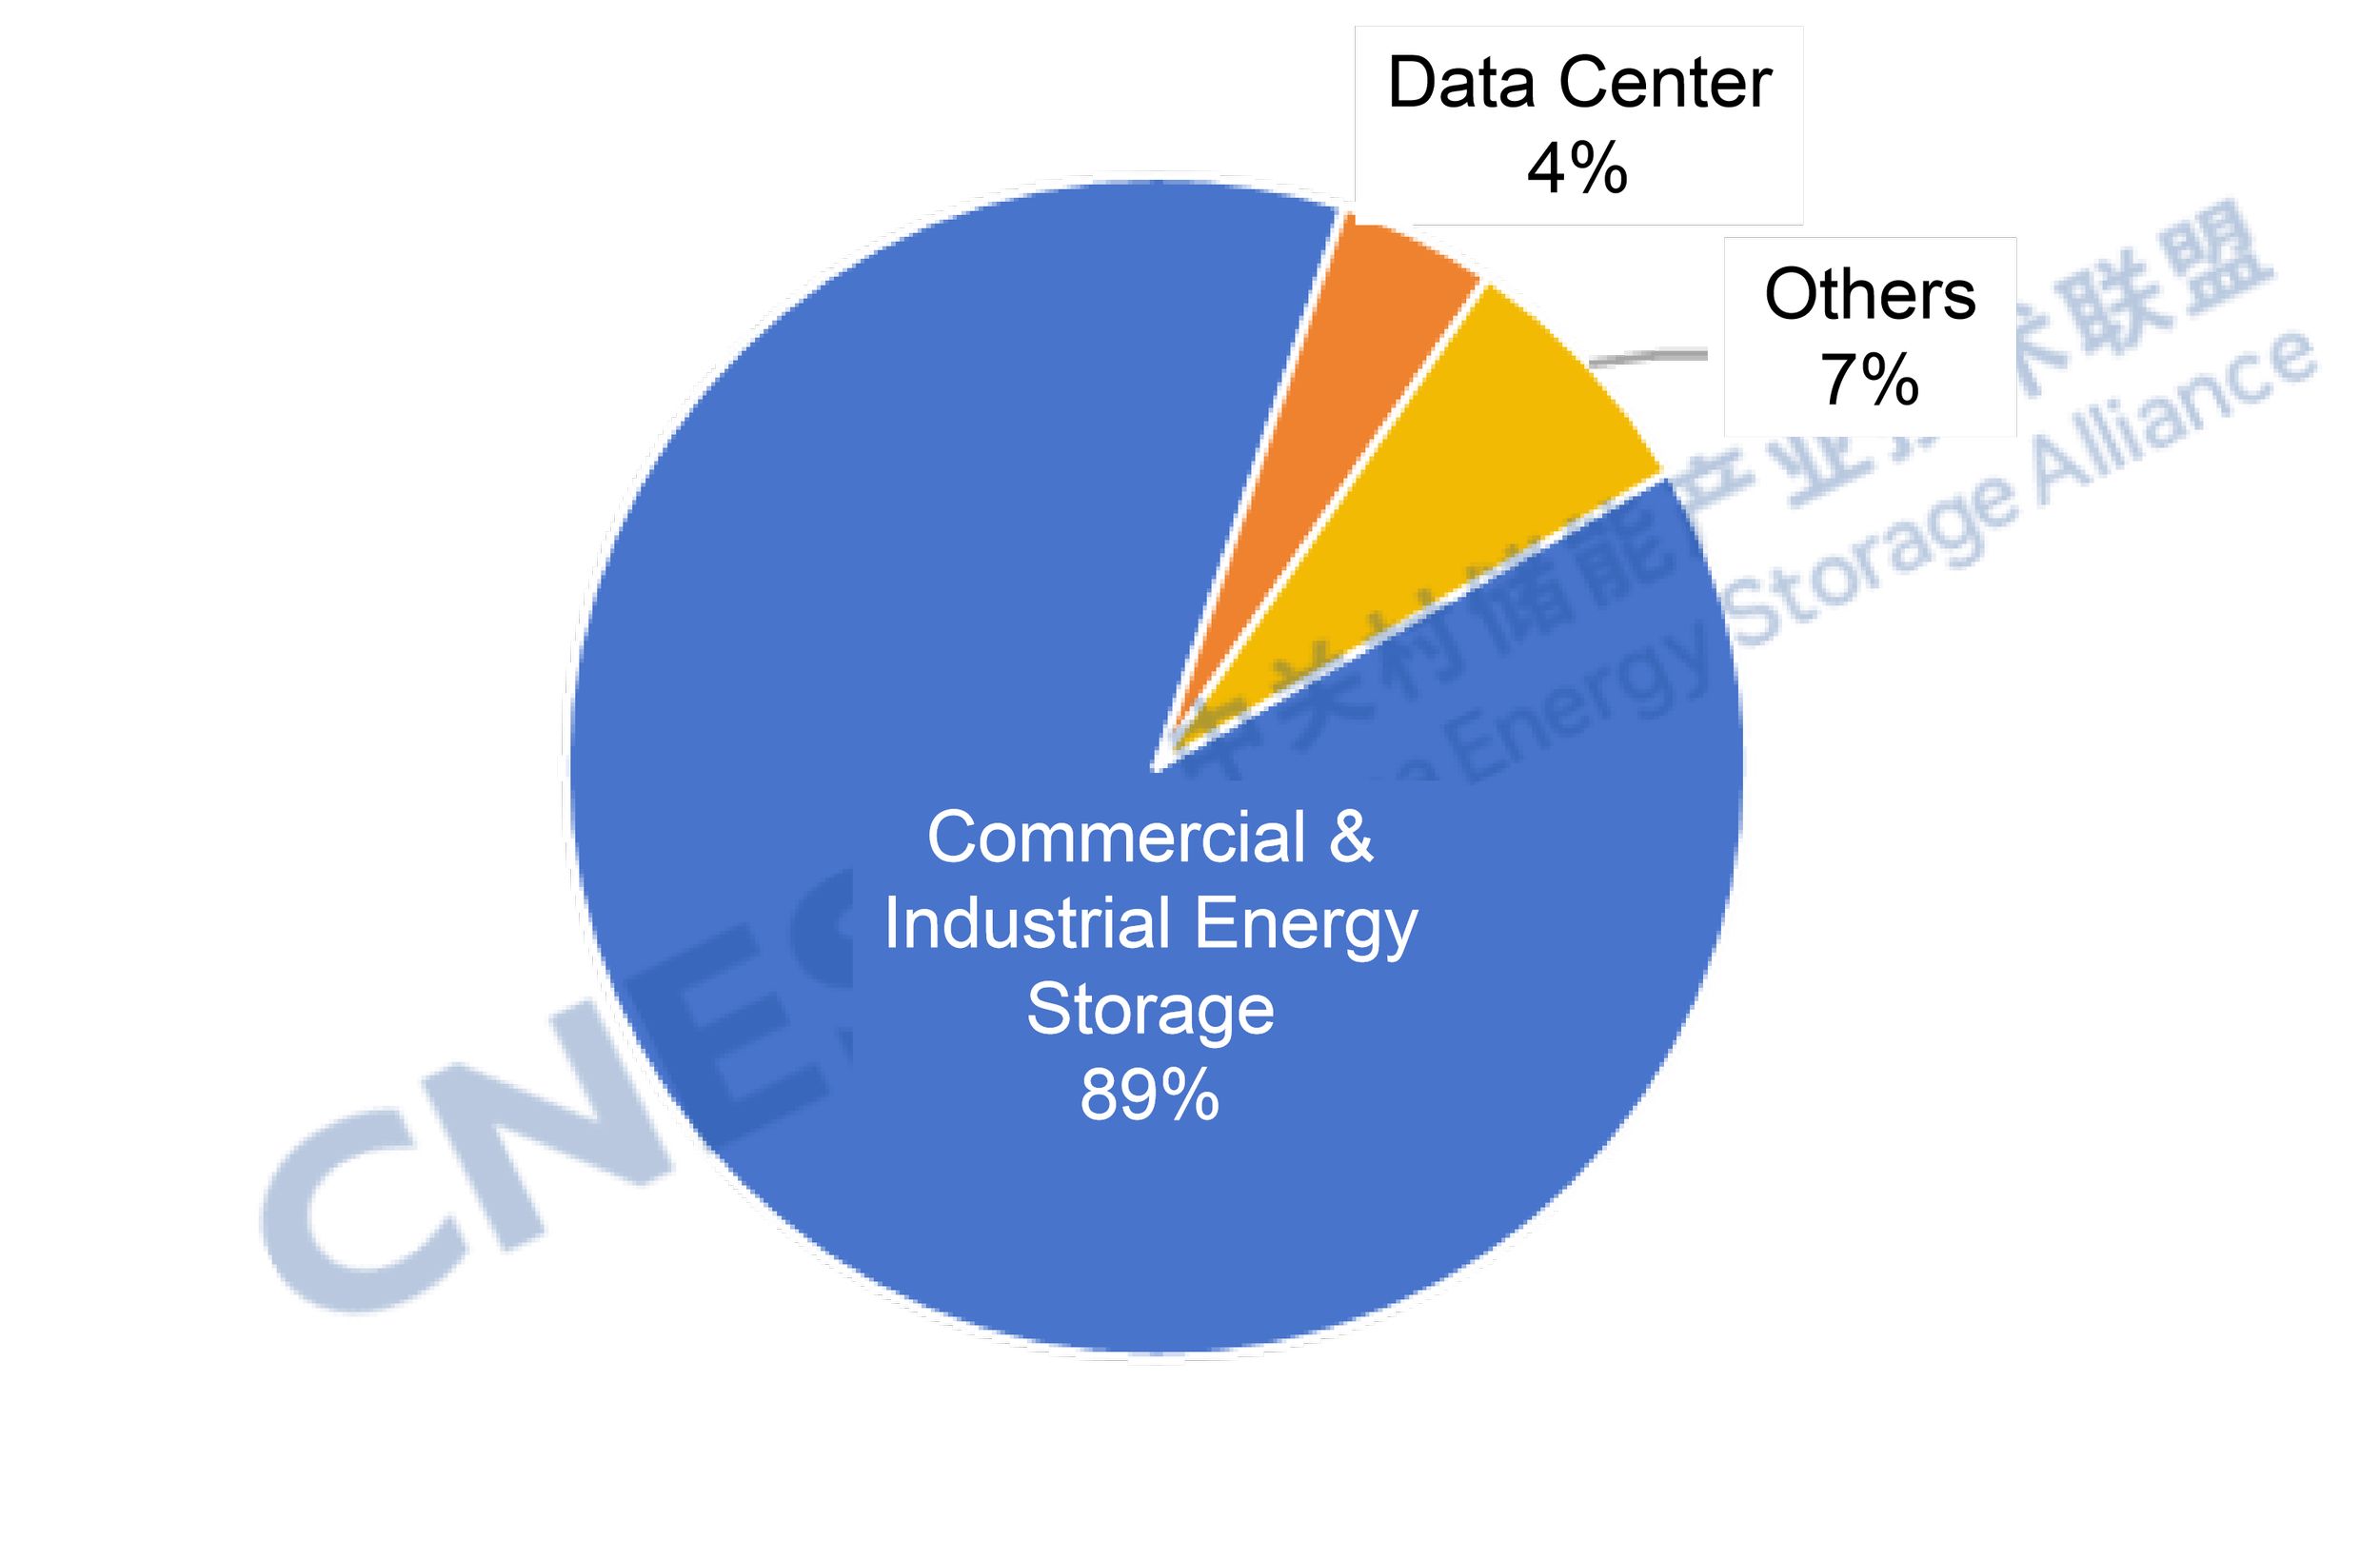
Figure 1: Application Distribution of Newly Commissioned User-Side New Energy Storage Projects in November 2025 (MW%)
Data Source: CNESA DataLink Global Energy Storage Database
https://www.esresearch.com.cn/
Note: “C&I” includes industrial facilities, industrial parks, and commercial buildings. “Others” include mining areas, oilfields, remote regions, and municipal institutions, etc.
(2) Regional Distribution of User-Side Energy Storage
By region, newly commissioned projects were mainly distributed across 11 provinces, including Fujian, Guangdong, Hebei, Anhui, and Zhejiang. East China led the market in November, accounting for 52% of newly installed capacity and 39% of total projects, ranking first nationwide in both installed scale and number of commissioned projects.
At the provincial level, Fujian recorded the largest share of newly installed power capacity, exceeding 25%, while Hebei led in newly installed energy capacity, accounting for 40%. Guangdong had the highest number of newly commissioned projects, representing over 18%, ranking first nationwide.
Fujian hosts a high concentration of energy-intensive industries such as steel and chemicals, where demand for peak shaving, valley filling, and backup power is strong. In addition, diversified application scenarios - including integrated PV-storage-charging systems and virtual power plant aggregation - are being increasingly developed, leaving substantial growth potential for the user-side energy storage market.
From an industrial and supply chain perspective, Fujian is home to the country's largest lithium battery R&D and manufacturing base, with lithium battery production capacity ranking among the national leaders. Driven by leading energy storage companies, a complete local supply chain has been established for core components such as cells, PCS, BMS, and EMS, effectively reducing overall system costs. Moreover, Fujian supports energy storage project financing through green credit and industrial funds, covering multiple project types including pumped hydro storage and new energy storage.
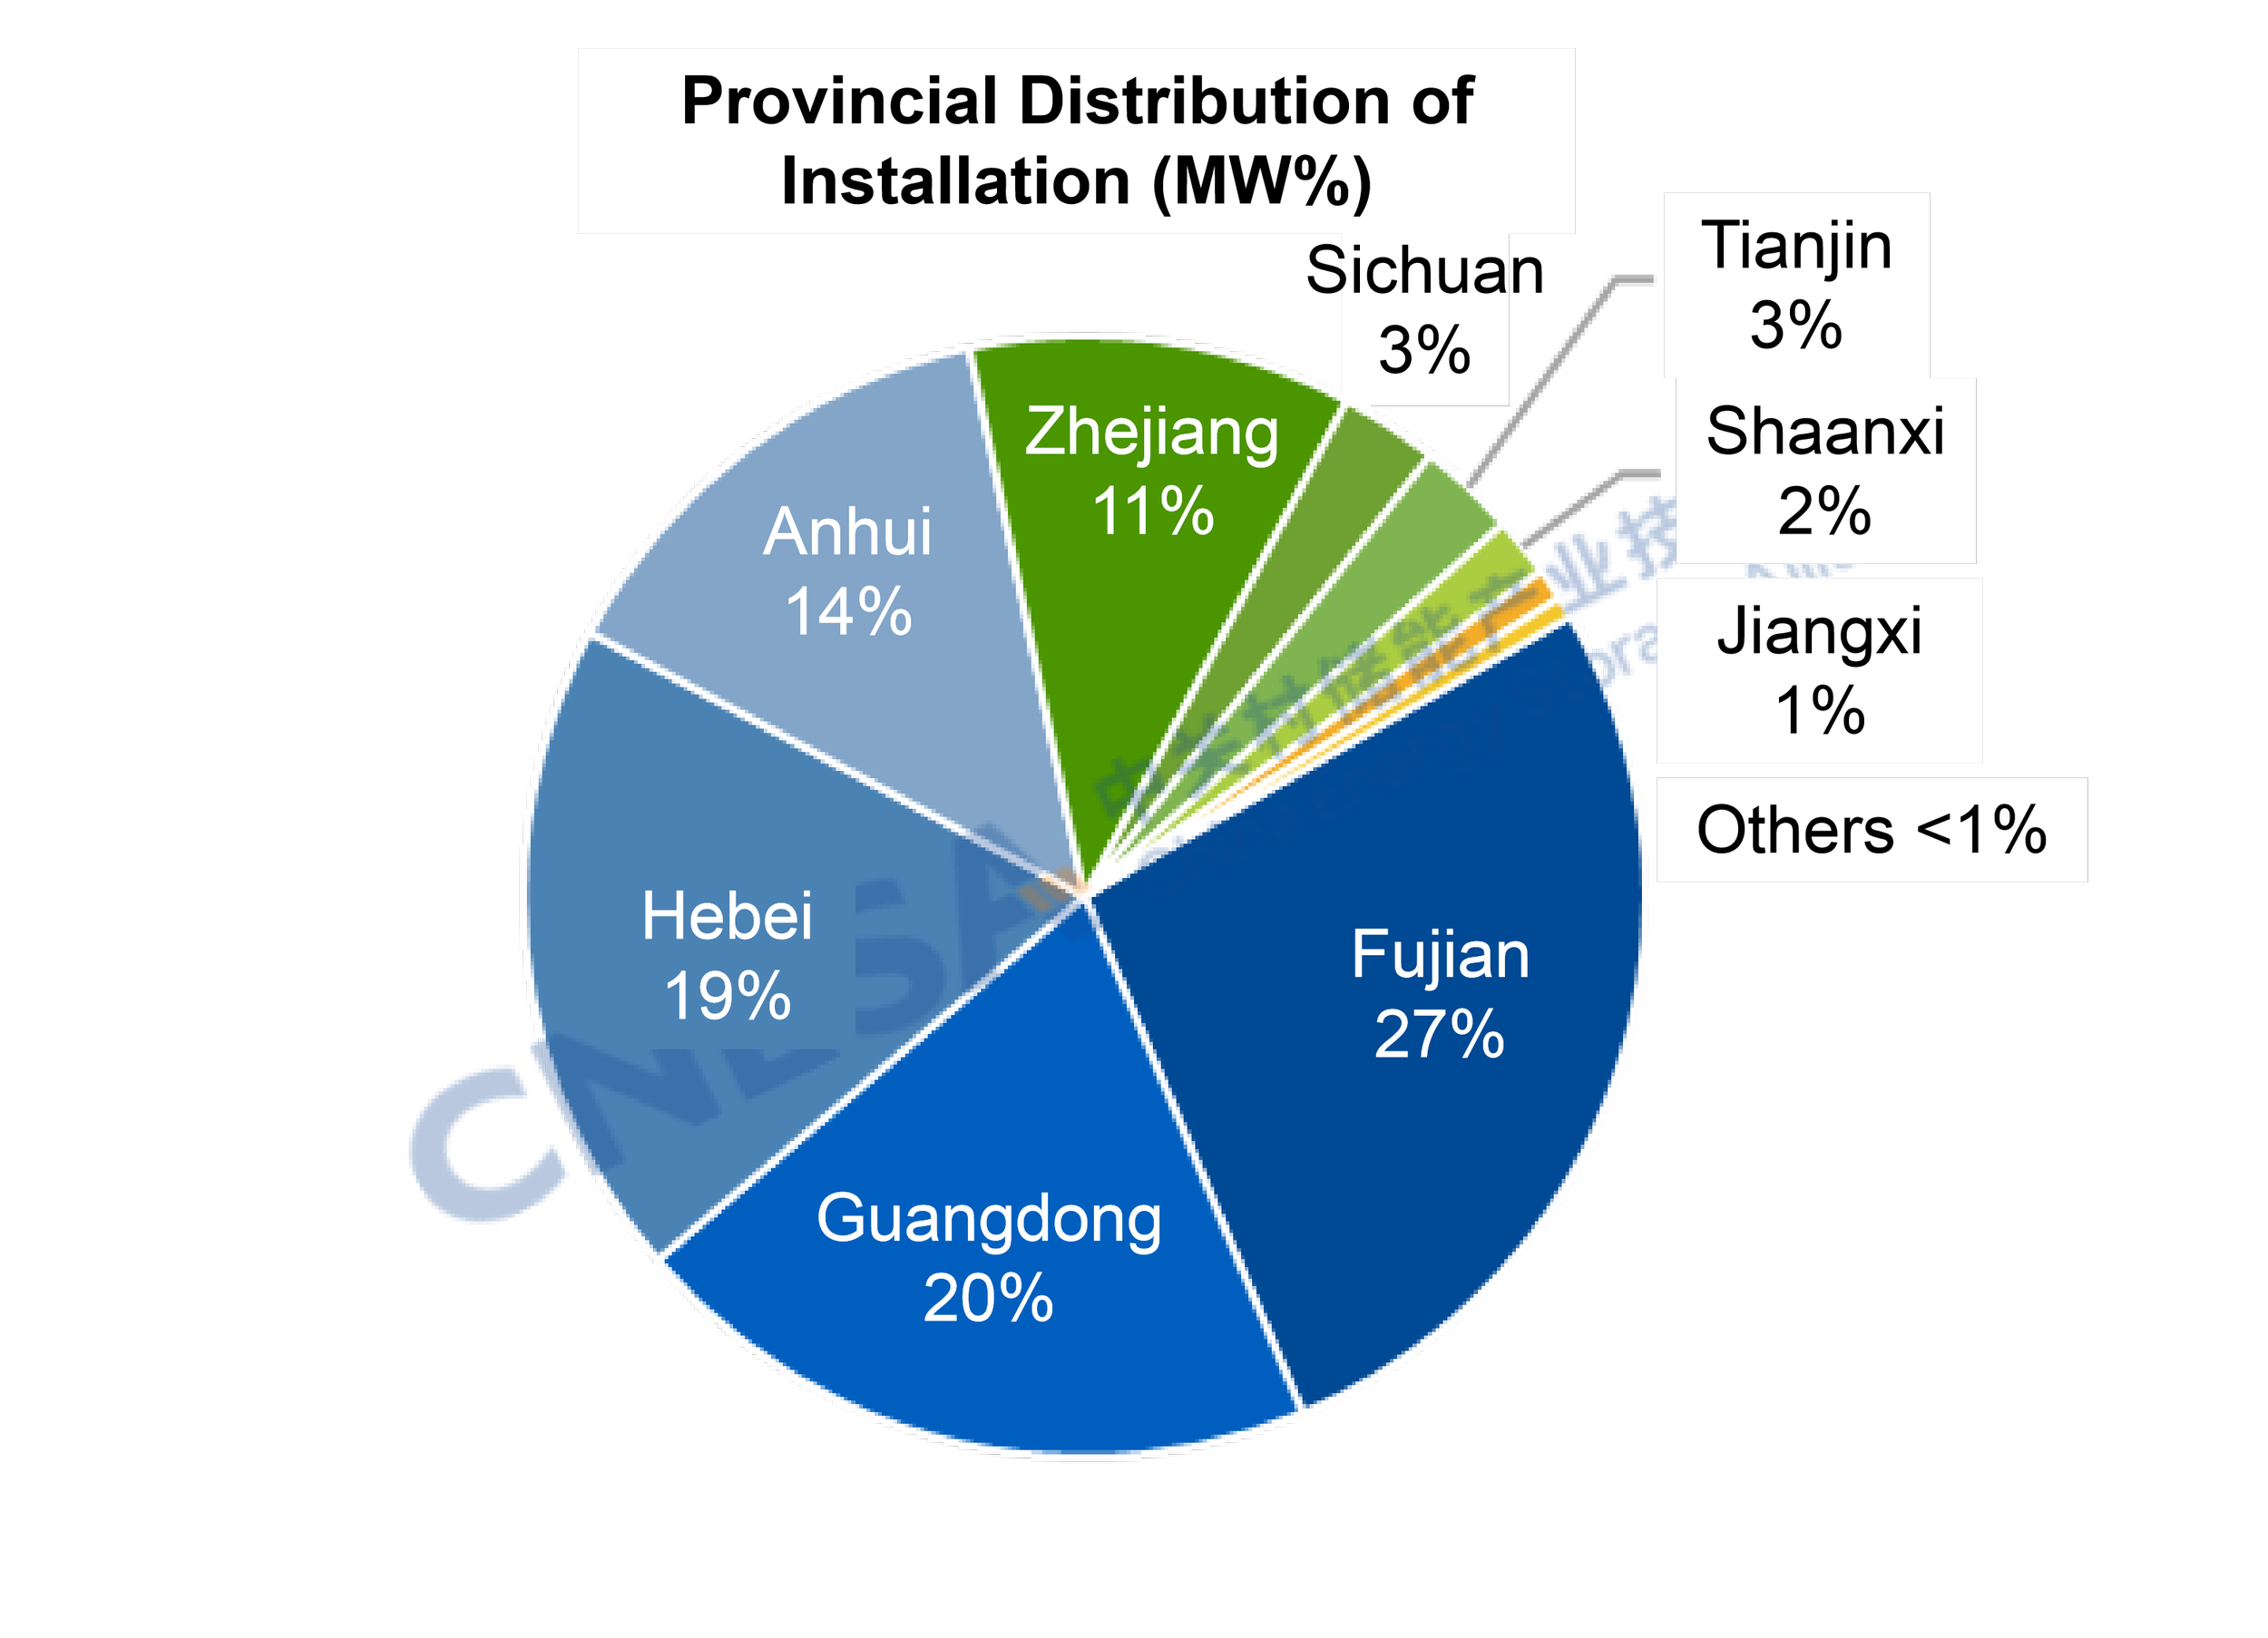
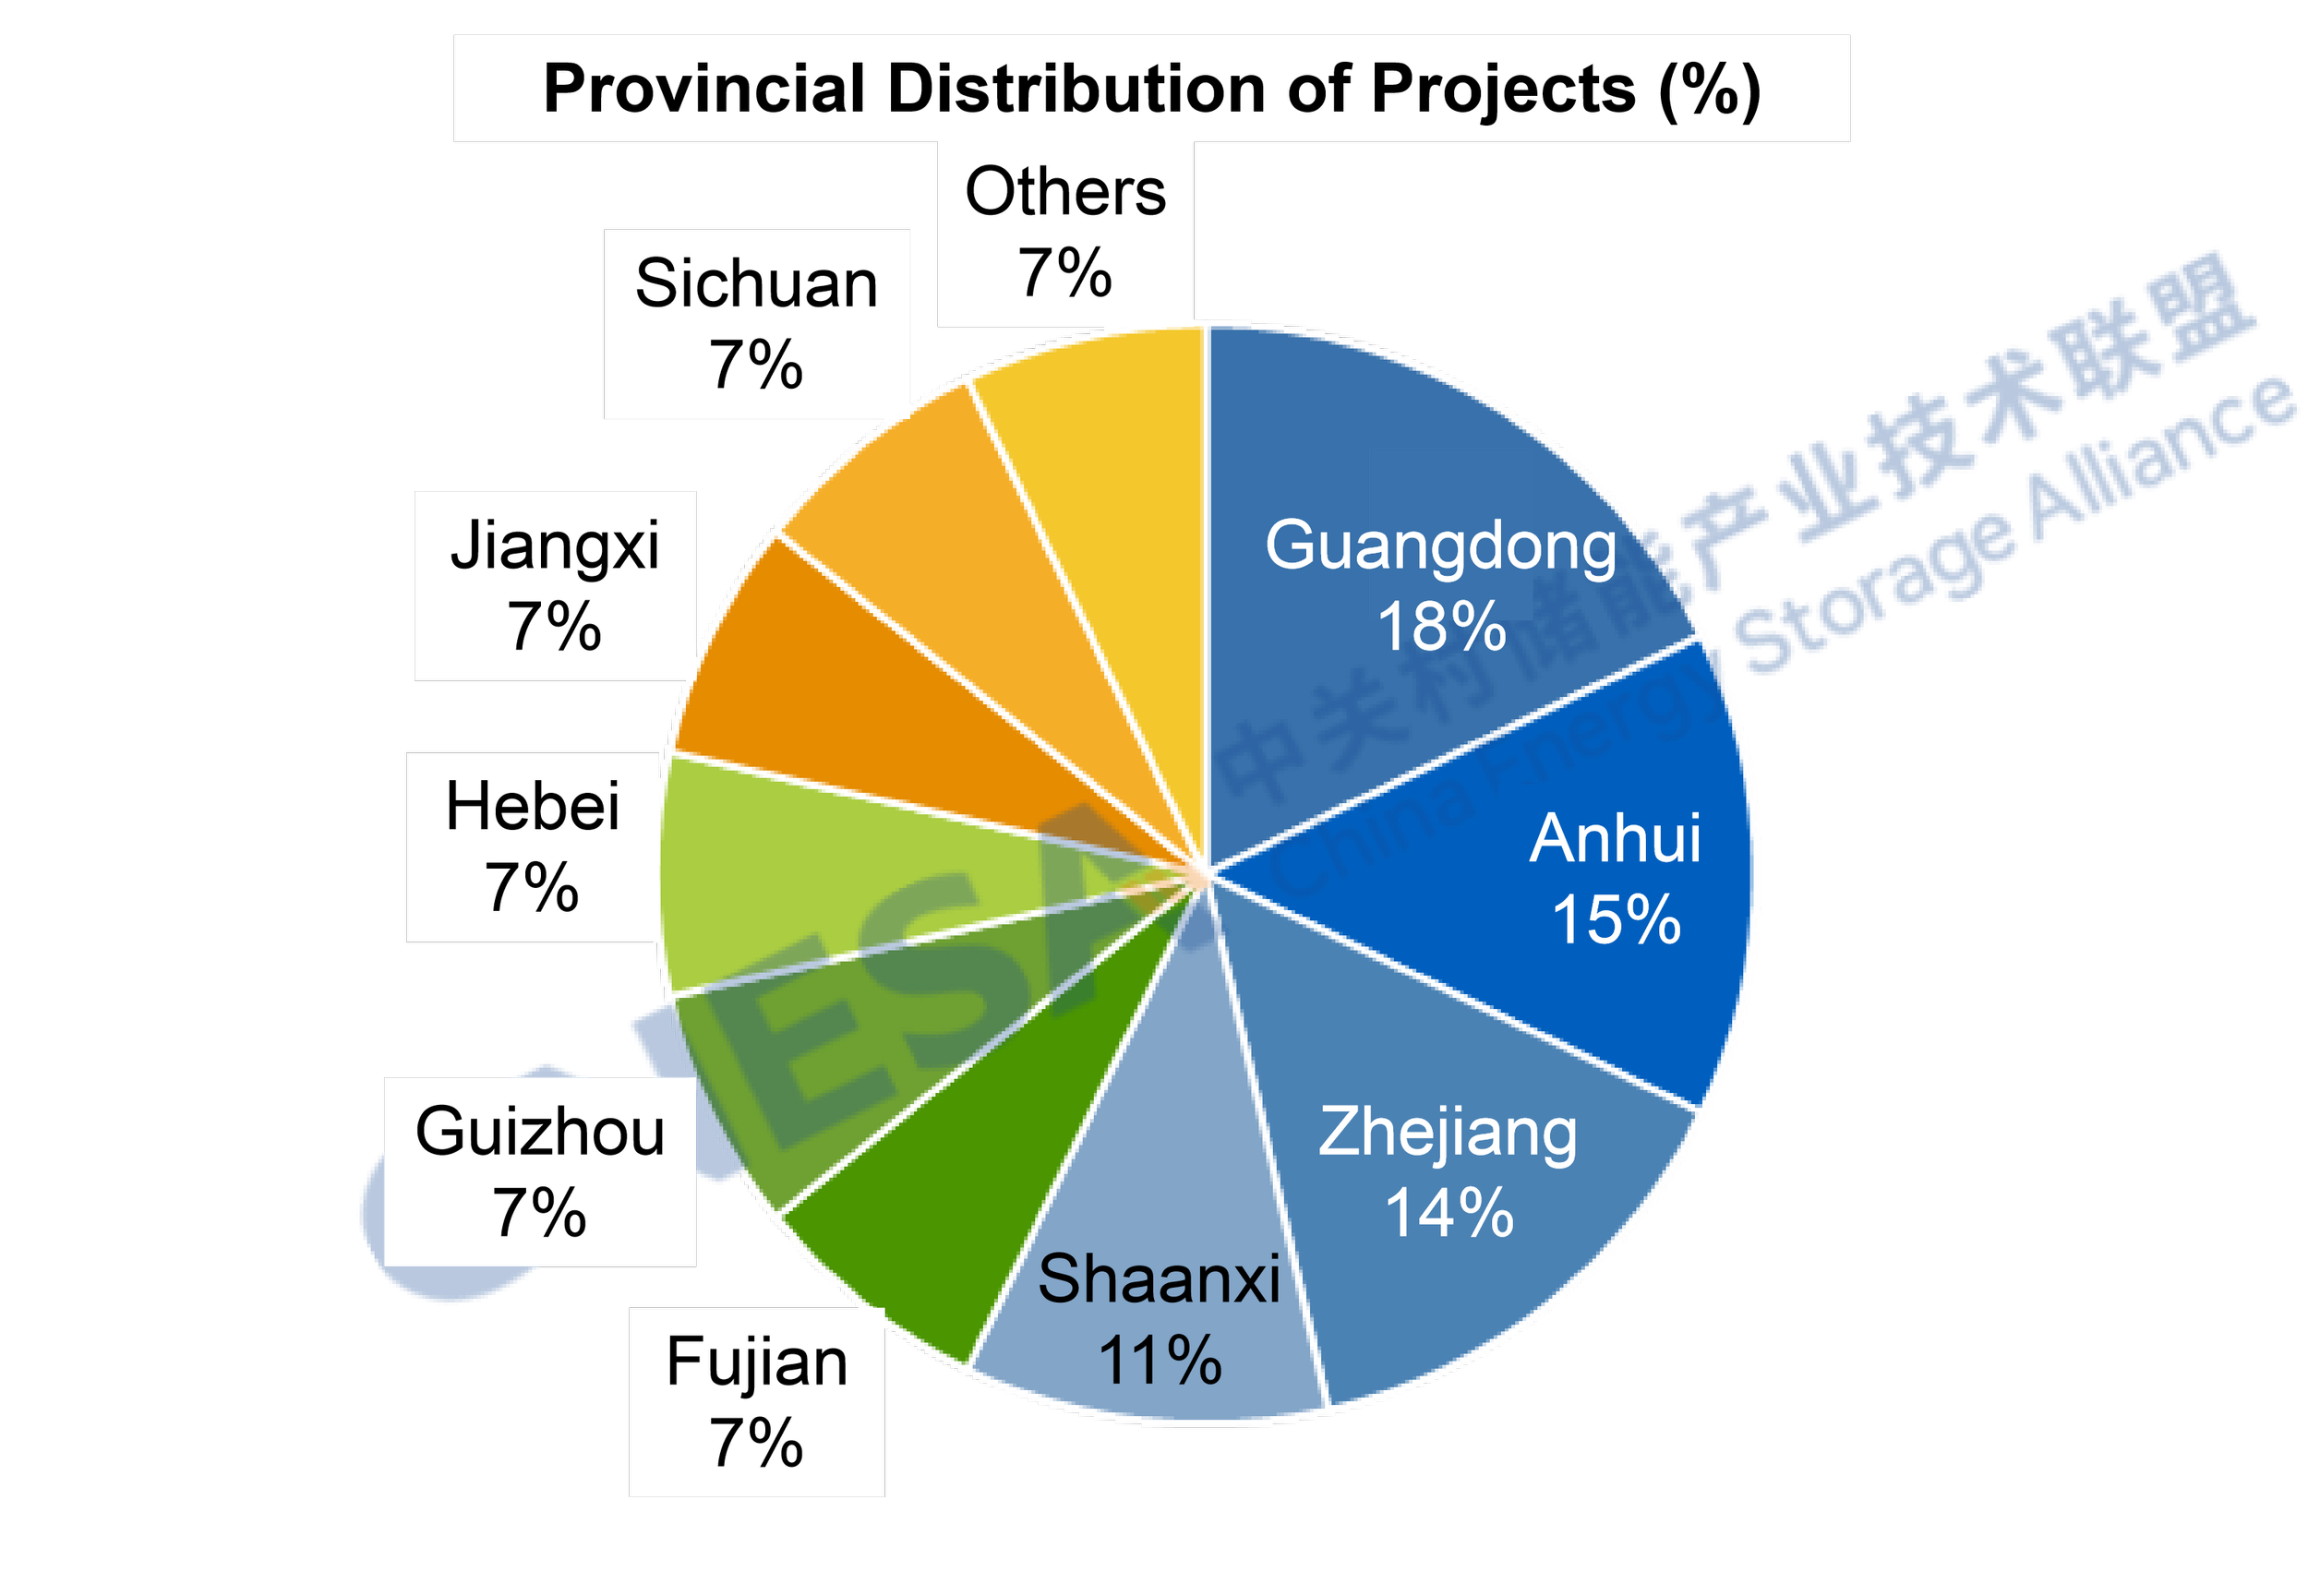
Figure 2: Provincial Distribution of Newly Operating User-Side New Energy Storage Projects in China, November 2025
Data Source: CNESA DataLink Global Energy Storage Database
https://www.esresearch.com.cn/
(3) Filed User-Side Energy Storage Projects
Based on project filings, national user-side market demand in November exceeded the level of the same period last year, with differentiated regional adjustments. Nationwide, both the total scale and number of newly filed user-side projects in November were higher year-on-year, up 8% and 5%, respectively. However, filing activity in traditional markets - Zhejiang, Guangdong, and Jiangsu - declined compared with last year.
Across these three provinces, a total of 497 new projects were filed, down 47% year-on-year, while energy capacity declined 7% year-on-year.
Guangdong recorded the highest number of newly filed projects, but project count fell 25% year-on-year, and scale declined 73%.
Zhejiang saw the largest drop in project count, down 65% year-on-year, with scale decreasing 34%.
Jiangsu recorded a 48% year-on-year decline in project count, but project scale increased 6%.
In November, Jiangsu ranked first nationwide in newly filed project scale. The average project size was approximately twice that of the same period last year, indicating a shift in user-side energy storage development from small-scale, distributed projects toward large-scale, centralized investments in high-quality application scenarios.
Meanwhile, Anhui, Henan, and Sichuan collectively added 440 newly filed projects, up 89% year-on-year and 47% month-on-month, accounting for about 38% of the national total, 5 percentage points higher than in October. Emerging user-side markets represented by Anhui, Henan, and Sichuan are rapidly releasing growth potential and are expected to become new engines driving nationwide user-side energy storage market growth.
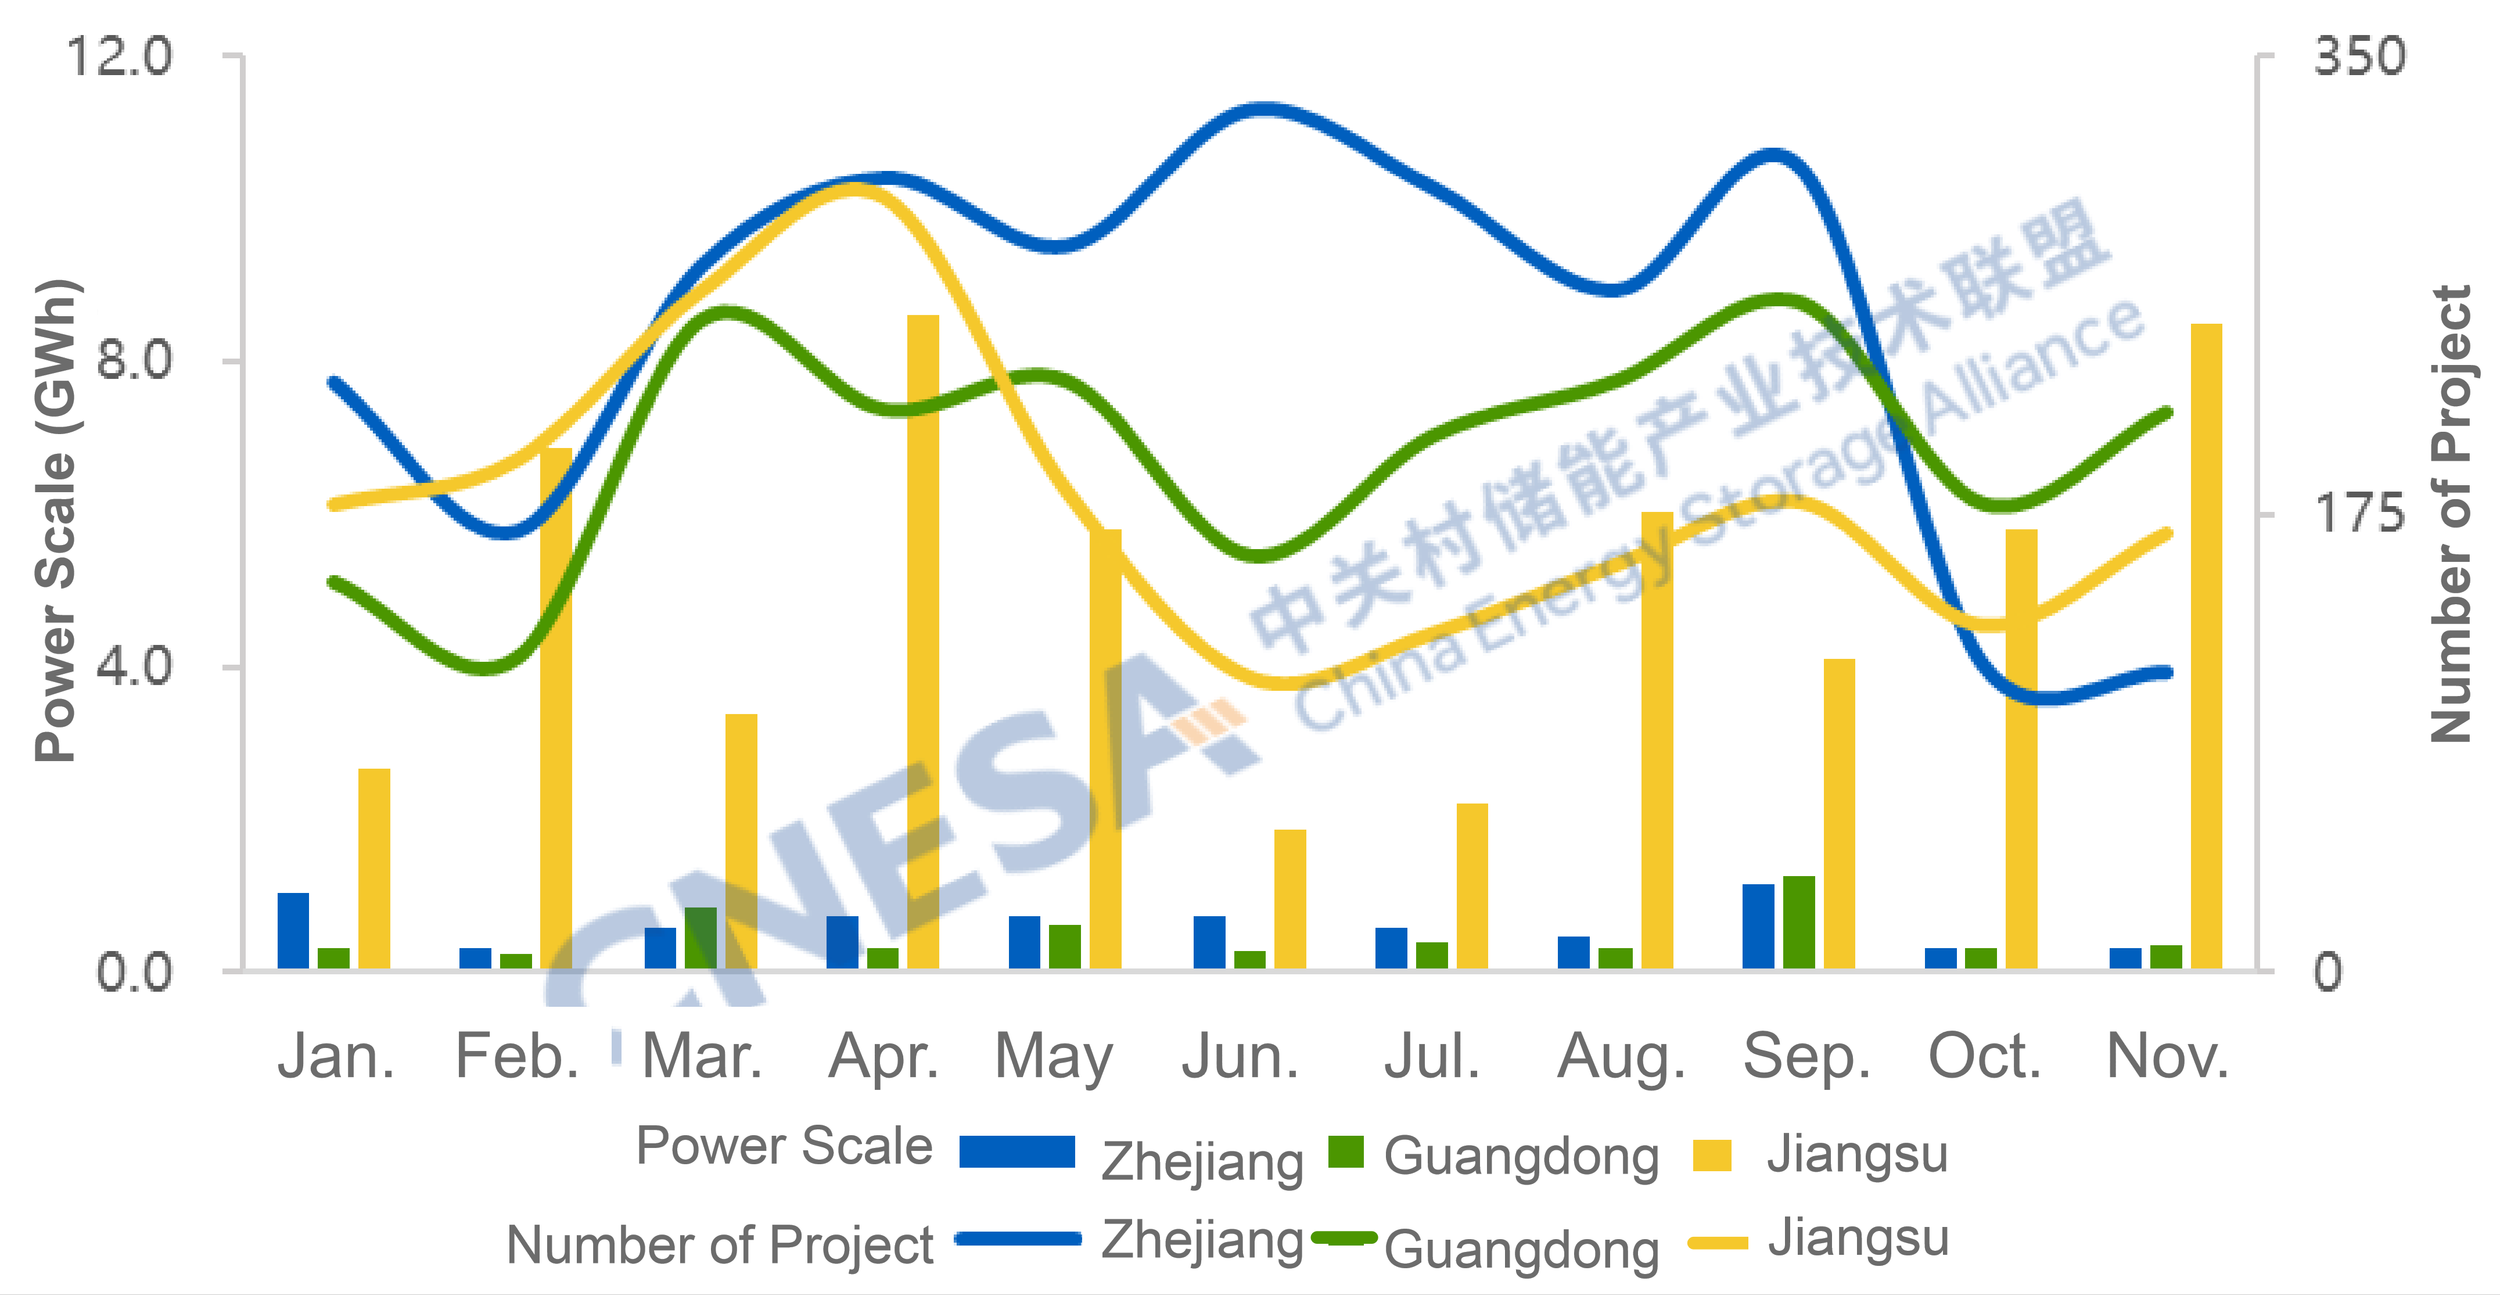
Figure 3: Monthly Distribution of Newly Filed Energy Storage Project Scale in Zhejiang, Guangdong, and Jiangsu (January - November 2025)
Data Source: CNESA DataLink Global Energy Storage Database
https://www.esresearch.com.cn/
Overall Analysis of New Energy Storage Projects in November
According to incomplete statistics from CNESA, in November 2025, newly commissioned new energy storage projects in China totaled 3.51 GW / 11.18 GWh, representing -22% / -7% year-on-year, and +81% / +180% month-on-month. While monthly additions continued to decline year-on-year, cumulative newly installed capacity in the first eleven months reached 39.5 GW, up 28% year-on-year. Considering the potential for concentrated grid connections ahead of the “12.30” commissioning deadline, total new installations for the year are expected to exceed last year's level.

Figure 4: Installed Capacity of Newly Operating New Energy Storage Projects in China, January - November 2025
Data Source: CNESA DataLink Global Energy Storage Database
https://www.esresearch.com.cn/
Note: Year-on-year comparisons are based on the same period of the previous year; month-on-month comparisons are based on the immediately preceding statistical period.
The China Energy Storage Alliance (CNESA) has consistently adhered to standardized, timely, and comprehensive information collection practices to continuously track developments in energy storage projects. Leveraging its long-term data accumulation and in-depth professional analysis, CNESA regularly publishes objective market analyses on installed energy storage capacity, providing valuable references for industry decision-making. Since June 2025, the monthly energy storage project analysis has been divided into two sections: “Grid&Source-Side Market” and “User-Side Market”. This issue focuses on interpreting the user-side market in November.
CENSA Upcoming Events:
Apr. 1-3, 2026 | The 14th Energy Storage International Conference & Expo
Register Now to attend, free before Dec 31, 2025.

Sign up for our free monthly newsletter to stay informed about the Chinese energy storage market.