

Latest News
New Installations Down 67% YoY: Analysis of China's User-Side New Energy Storage Projects in November
Source: CNESA
In November 2025, newly installed user-side new energy storage capacity in China recorded a year-on-year decline of over 65%.
Compared with October, the market structure showed notable adjustments:
Commercial and industrial (C&I) energy storage accounted for nearly 90%, while long-duration energy storage technologies accelerated deployment.
East China contributed more than half of newly commissioned capacity, with Fujian leading in installed capacity.
Although filing activity in traditional user-side markets (Zhejiang, Guangdong, Jiangsu) declined compared with the same period last year, overall demand remained higher year-on-year. Emerging markets such as Anhui, Henan, and Sichuan are becoming new growth engines driving the national user-side energy storage market.
Analysis of User-Side New Energy Storage Projects in November
In November, newly installed user-side capacity reached 185.27 MW / 555.83 MWh, representing -67% / -57% year-on-year, and -5% / +16% month-on-month. User-side new energy storage projects exhibited the following characteristics:
(1) Installed Capacity by Application
In November, the user-side energy storage market continued to be dominated by C&I applications, accounting for nearly 90% of total installations. Newly installed C&I capacity reached 163.9 MW / 541.3 MWh, -68% / -58% year-on-year, and -9% / +15% month-on-month.
The largest data center user-side energy storage project in Zhejiang was officially commissioned. Rapid development of AI data centers (AIDC) and intelligent computing centers is driving growth in user-side energy storage demand.
From a technology perspective, all newly commissioned projects adopted electrochemical energy storage technologies. Lithium iron phosphate (LFP) batteries accounted for over 99% of installed power capacity. In terms of long-duration storage, one 8-hour, 202 MWh lithium-based C&I energy storage project and one 8-hour, 2 MWh all-vanadium redox flow battery project were completed and put into operation.
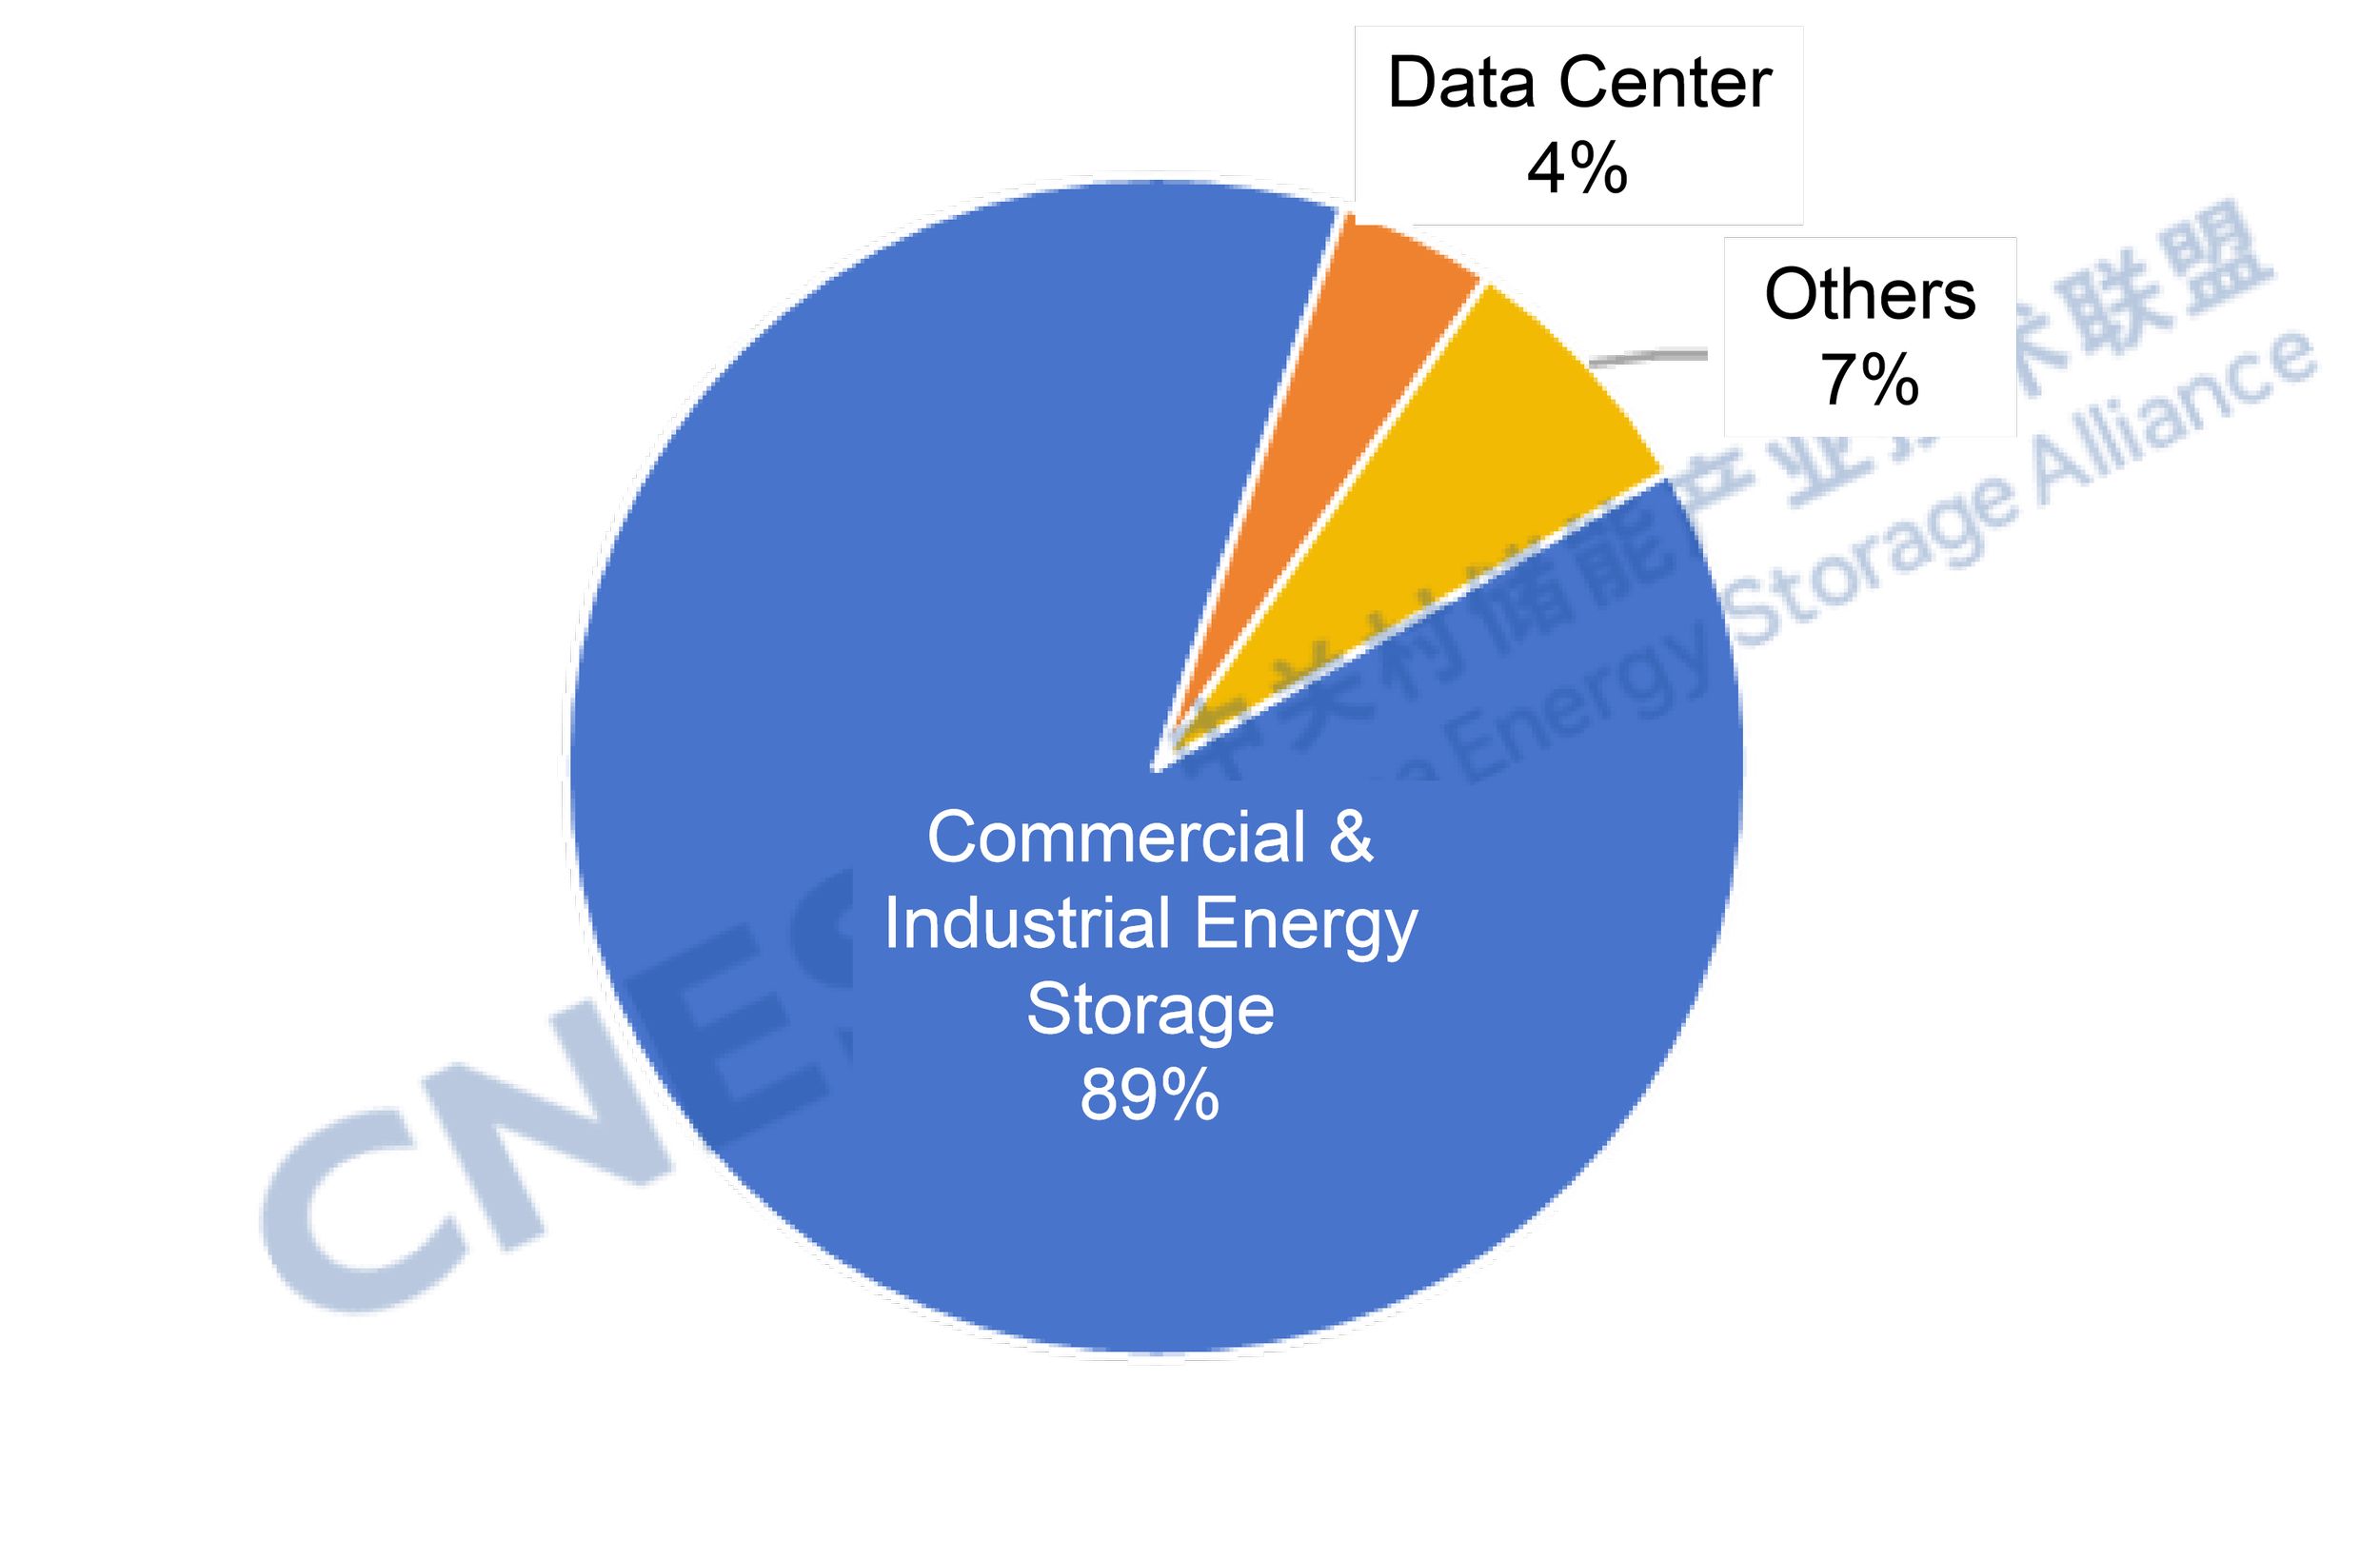
Figure 1: Application Distribution of Newly Commissioned User-Side New Energy Storage Projects in November 2025 (MW%)
Data Source: CNESA DataLink Global Energy Storage Database
https://www.esresearch.com.cn/
Note: “C&I” includes industrial facilities, industrial parks, and commercial buildings. “Others” include mining areas, oilfields, remote regions, and municipal institutions, etc.
(2) Regional Distribution of User-Side Energy Storage
By region, newly commissioned projects were mainly distributed across 11 provinces, including Fujian, Guangdong, Hebei, Anhui, and Zhejiang. East China led the market in November, accounting for 52% of newly installed capacity and 39% of total projects, ranking first nationwide in both installed scale and number of commissioned projects.
At the provincial level, Fujian recorded the largest share of newly installed power capacity, exceeding 25%, while Hebei led in newly installed energy capacity, accounting for 40%. Guangdong had the highest number of newly commissioned projects, representing over 18%, ranking first nationwide.
Fujian hosts a high concentration of energy-intensive industries such as steel and chemicals, where demand for peak shaving, valley filling, and backup power is strong. In addition, diversified application scenarios - including integrated PV-storage-charging systems and virtual power plant aggregation - are being increasingly developed, leaving substantial growth potential for the user-side energy storage market.
From an industrial and supply chain perspective, Fujian is home to the country's largest lithium battery R&D and manufacturing base, with lithium battery production capacity ranking among the national leaders. Driven by leading energy storage companies, a complete local supply chain has been established for core components such as cells, PCS, BMS, and EMS, effectively reducing overall system costs. Moreover, Fujian supports energy storage project financing through green credit and industrial funds, covering multiple project types including pumped hydro storage and new energy storage.
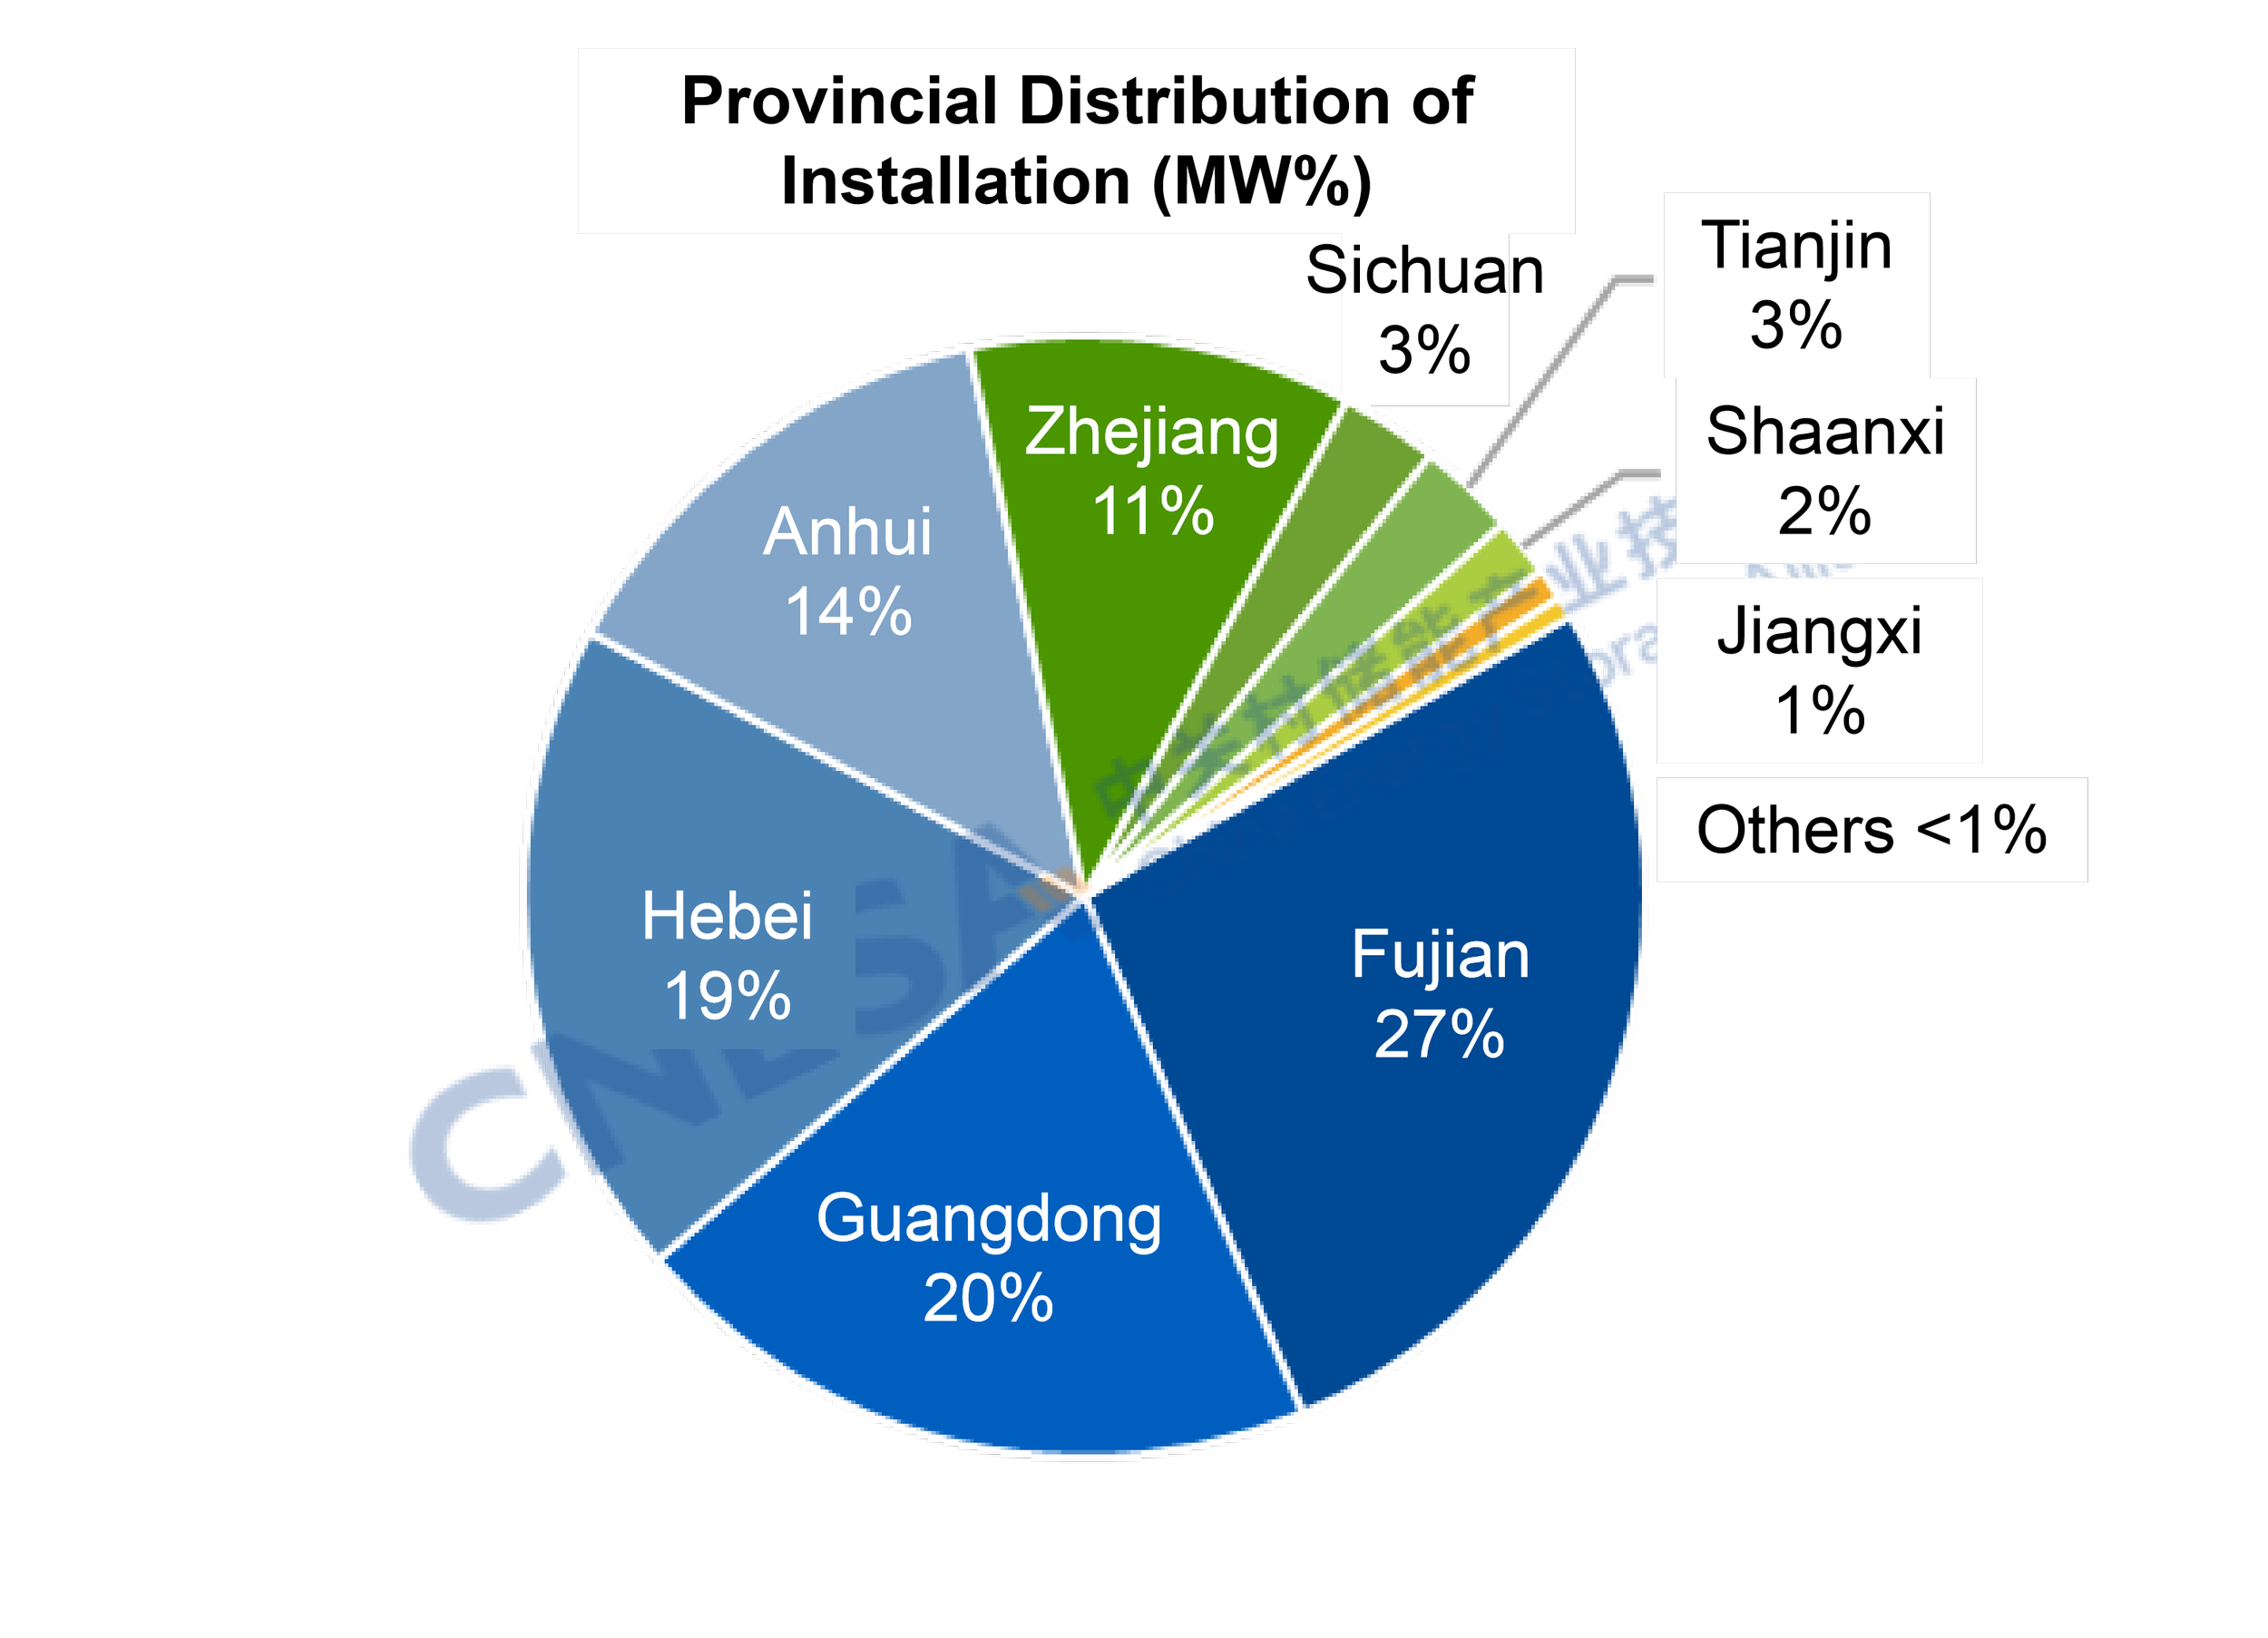
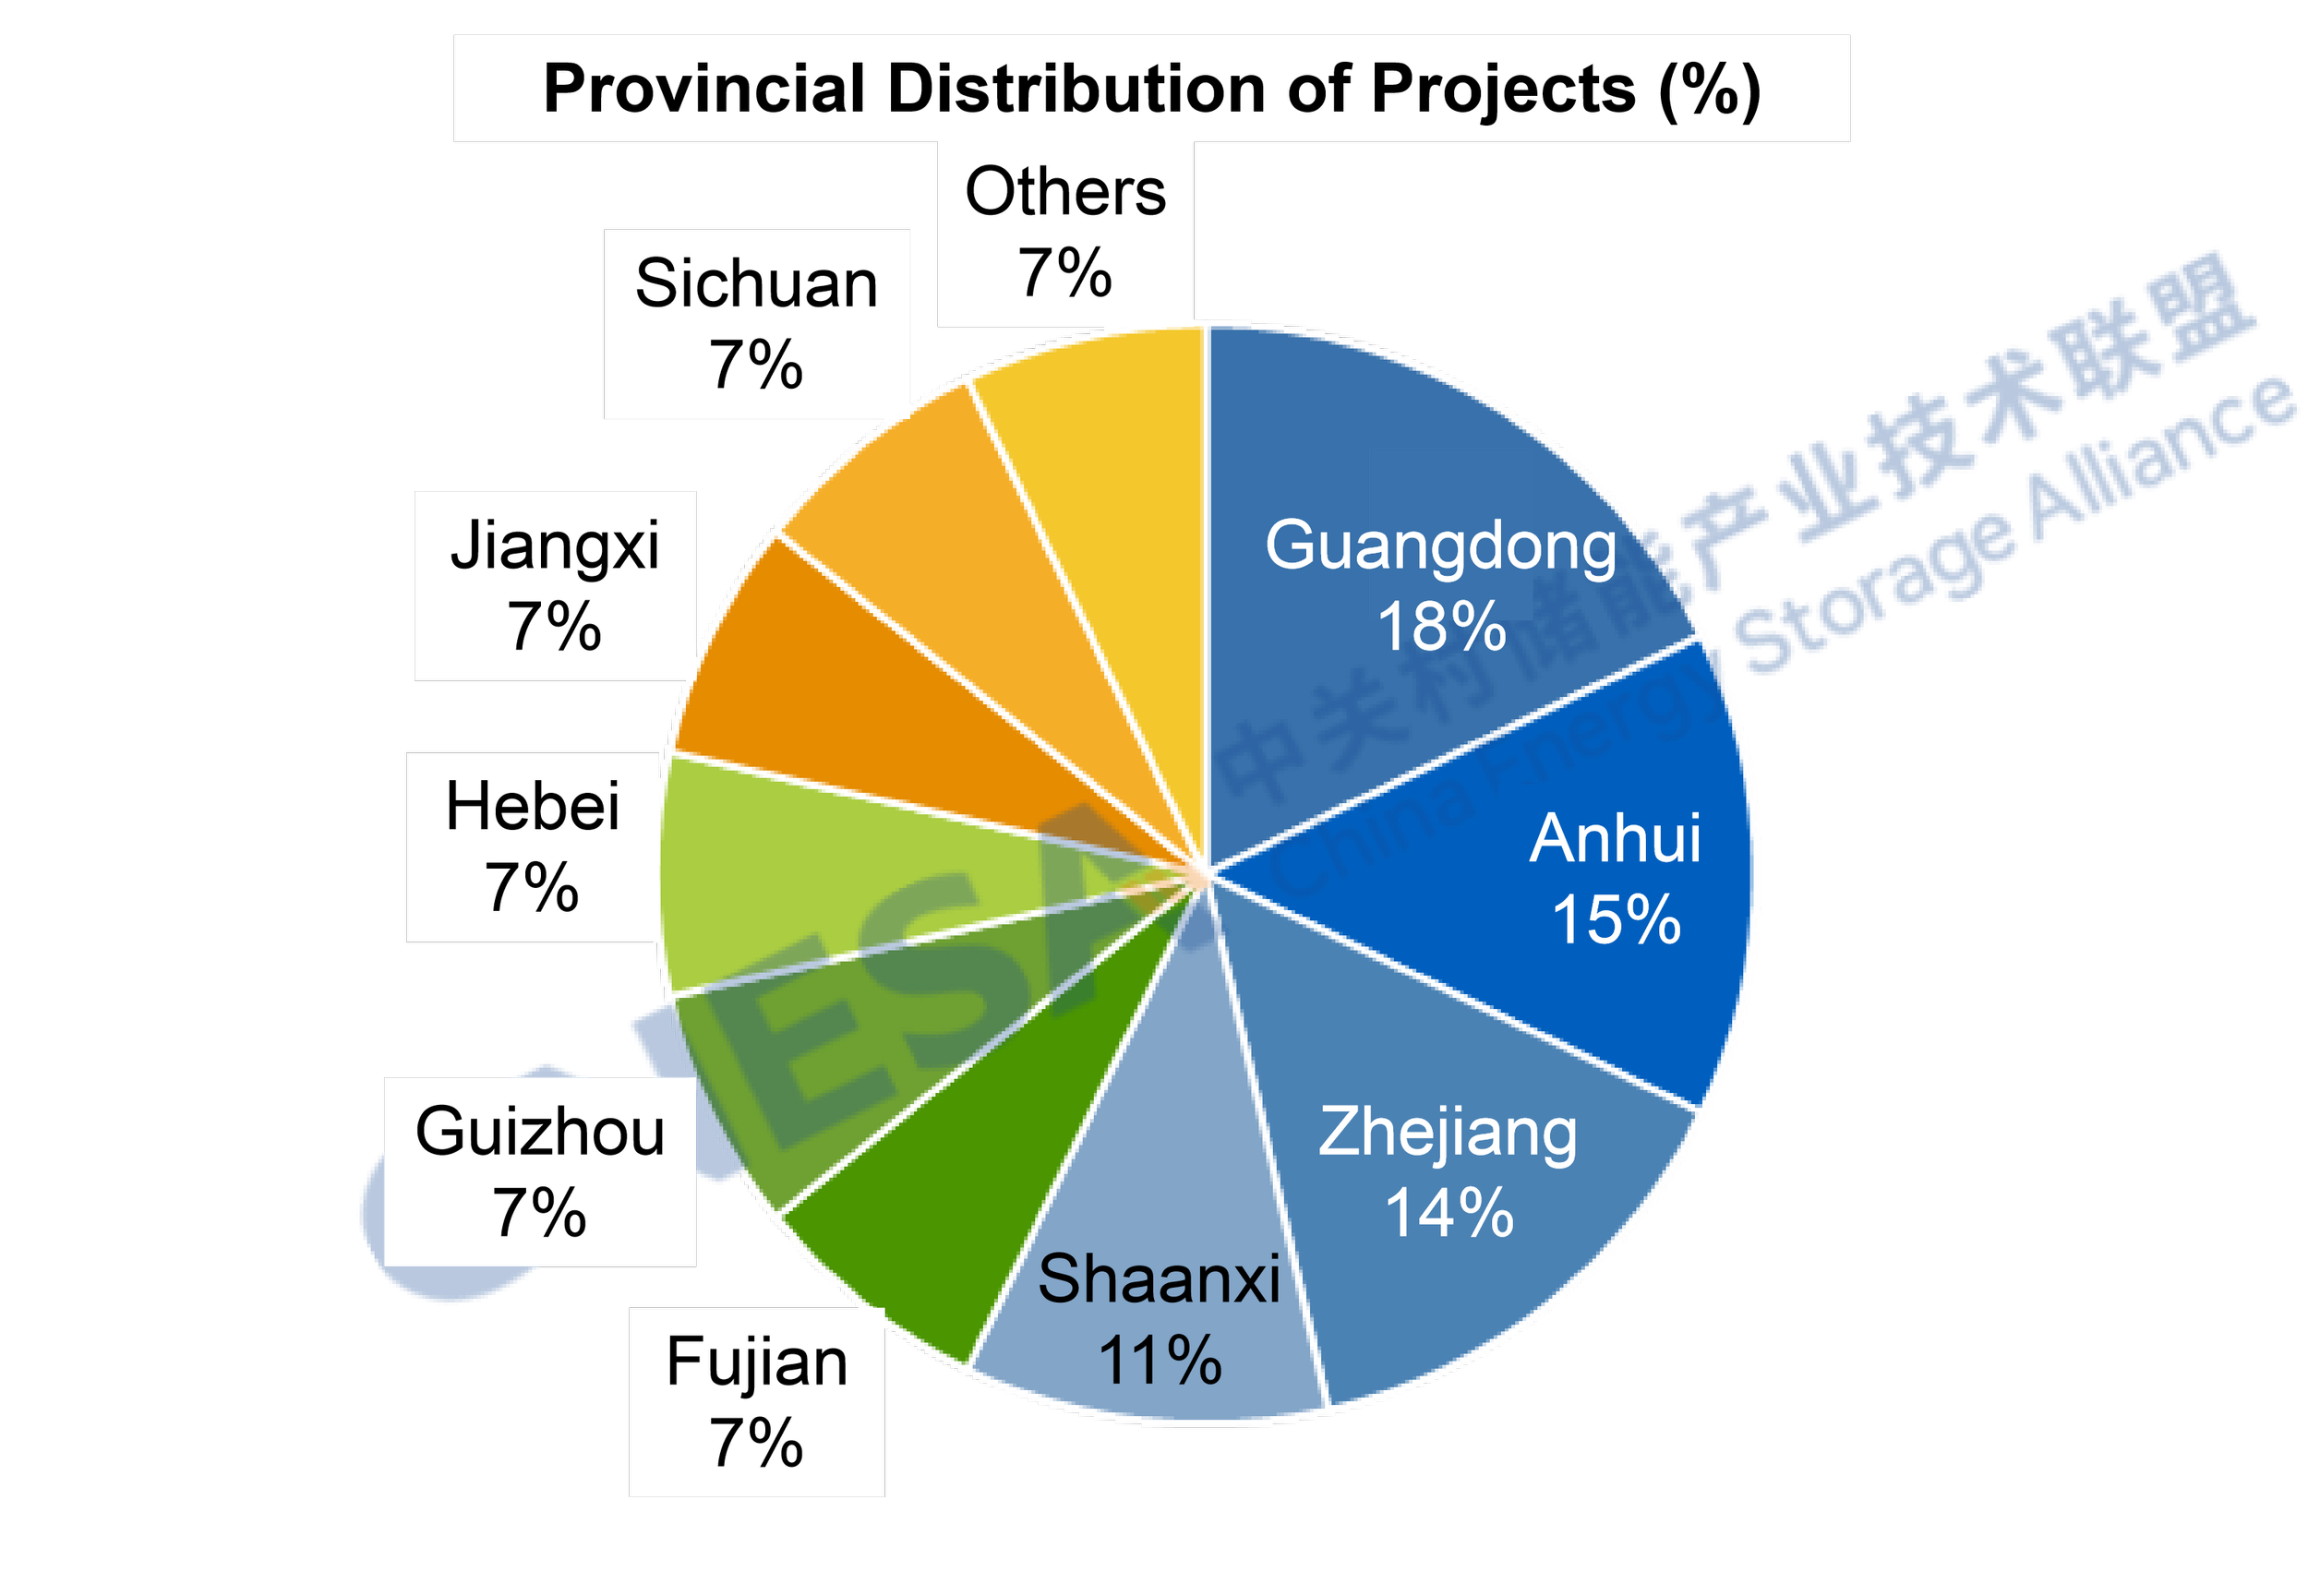
Figure 2: Provincial Distribution of Newly Operating User-Side New Energy Storage Projects in China, November 2025
Data Source: CNESA DataLink Global Energy Storage Database
https://www.esresearch.com.cn/
(3) Filed User-Side Energy Storage Projects
Based on project filings, national user-side market demand in November exceeded the level of the same period last year, with differentiated regional adjustments. Nationwide, both the total scale and number of newly filed user-side projects in November were higher year-on-year, up 8% and 5%, respectively. However, filing activity in traditional markets - Zhejiang, Guangdong, and Jiangsu - declined compared with last year.
Across these three provinces, a total of 497 new projects were filed, down 47% year-on-year, while energy capacity declined 7% year-on-year.
Guangdong recorded the highest number of newly filed projects, but project count fell 25% year-on-year, and scale declined 73%.
Zhejiang saw the largest drop in project count, down 65% year-on-year, with scale decreasing 34%.
Jiangsu recorded a 48% year-on-year decline in project count, but project scale increased 6%.
In November, Jiangsu ranked first nationwide in newly filed project scale. The average project size was approximately twice that of the same period last year, indicating a shift in user-side energy storage development from small-scale, distributed projects toward large-scale, centralized investments in high-quality application scenarios.
Meanwhile, Anhui, Henan, and Sichuan collectively added 440 newly filed projects, up 89% year-on-year and 47% month-on-month, accounting for about 38% of the national total, 5 percentage points higher than in October. Emerging user-side markets represented by Anhui, Henan, and Sichuan are rapidly releasing growth potential and are expected to become new engines driving nationwide user-side energy storage market growth.
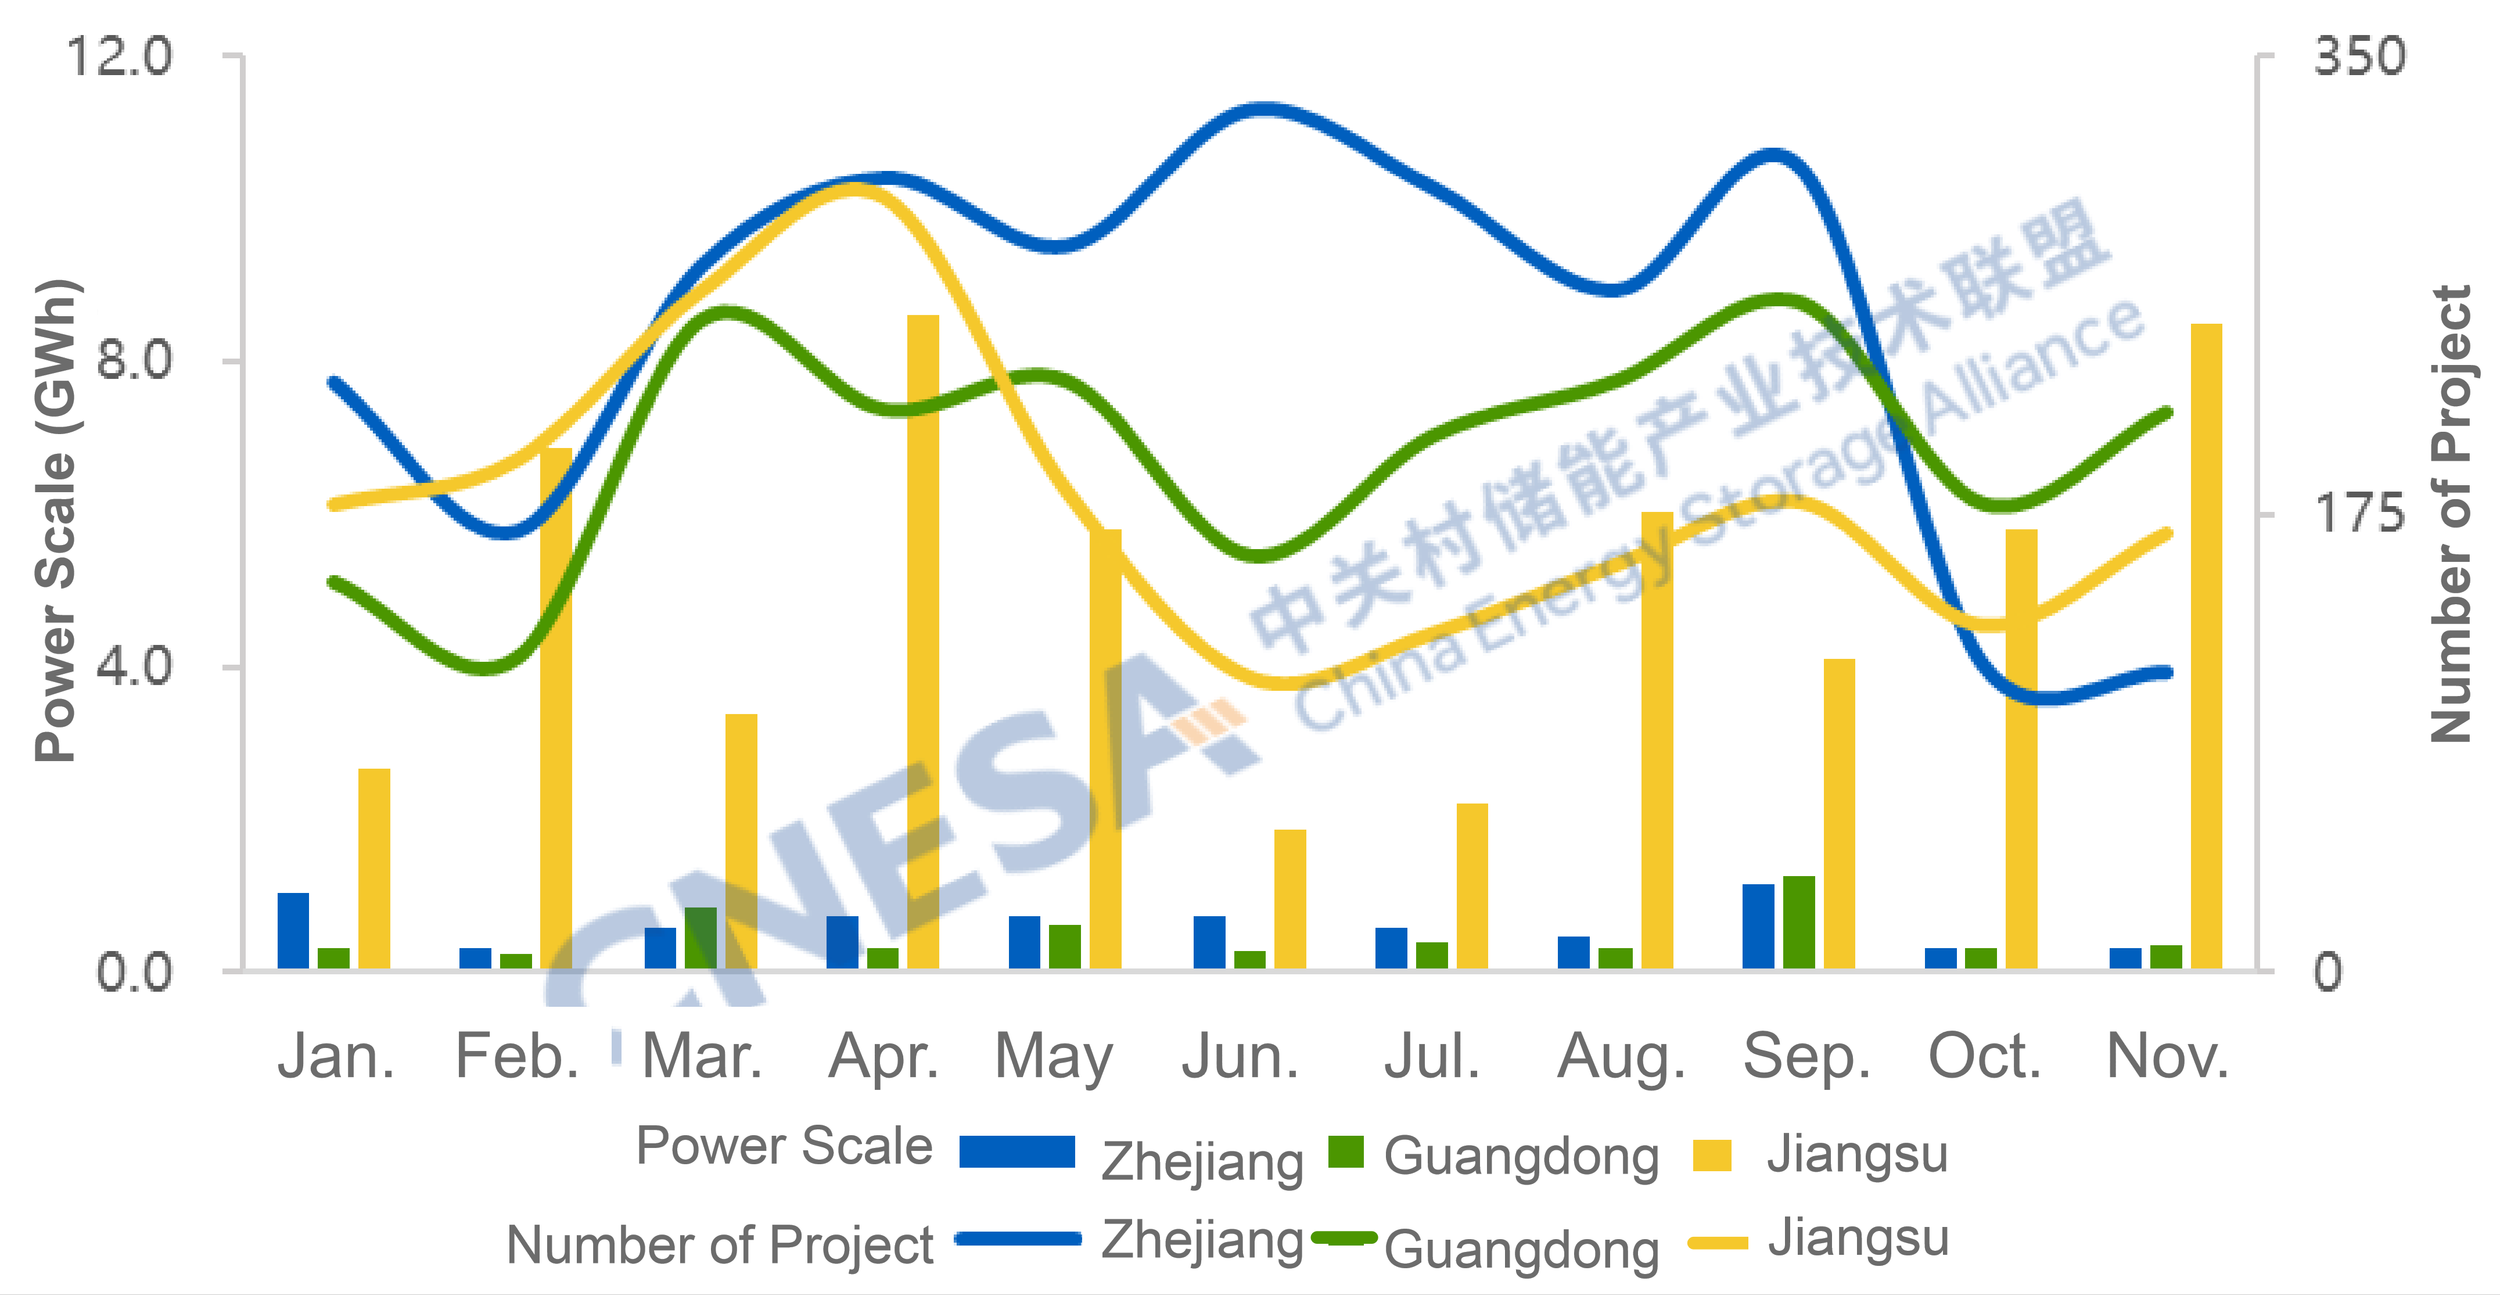
Figure 3: Monthly Distribution of Newly Filed Energy Storage Project Scale in Zhejiang, Guangdong, and Jiangsu (January - November 2025)
Data Source: CNESA DataLink Global Energy Storage Database
https://www.esresearch.com.cn/
Overall Analysis of New Energy Storage Projects in November
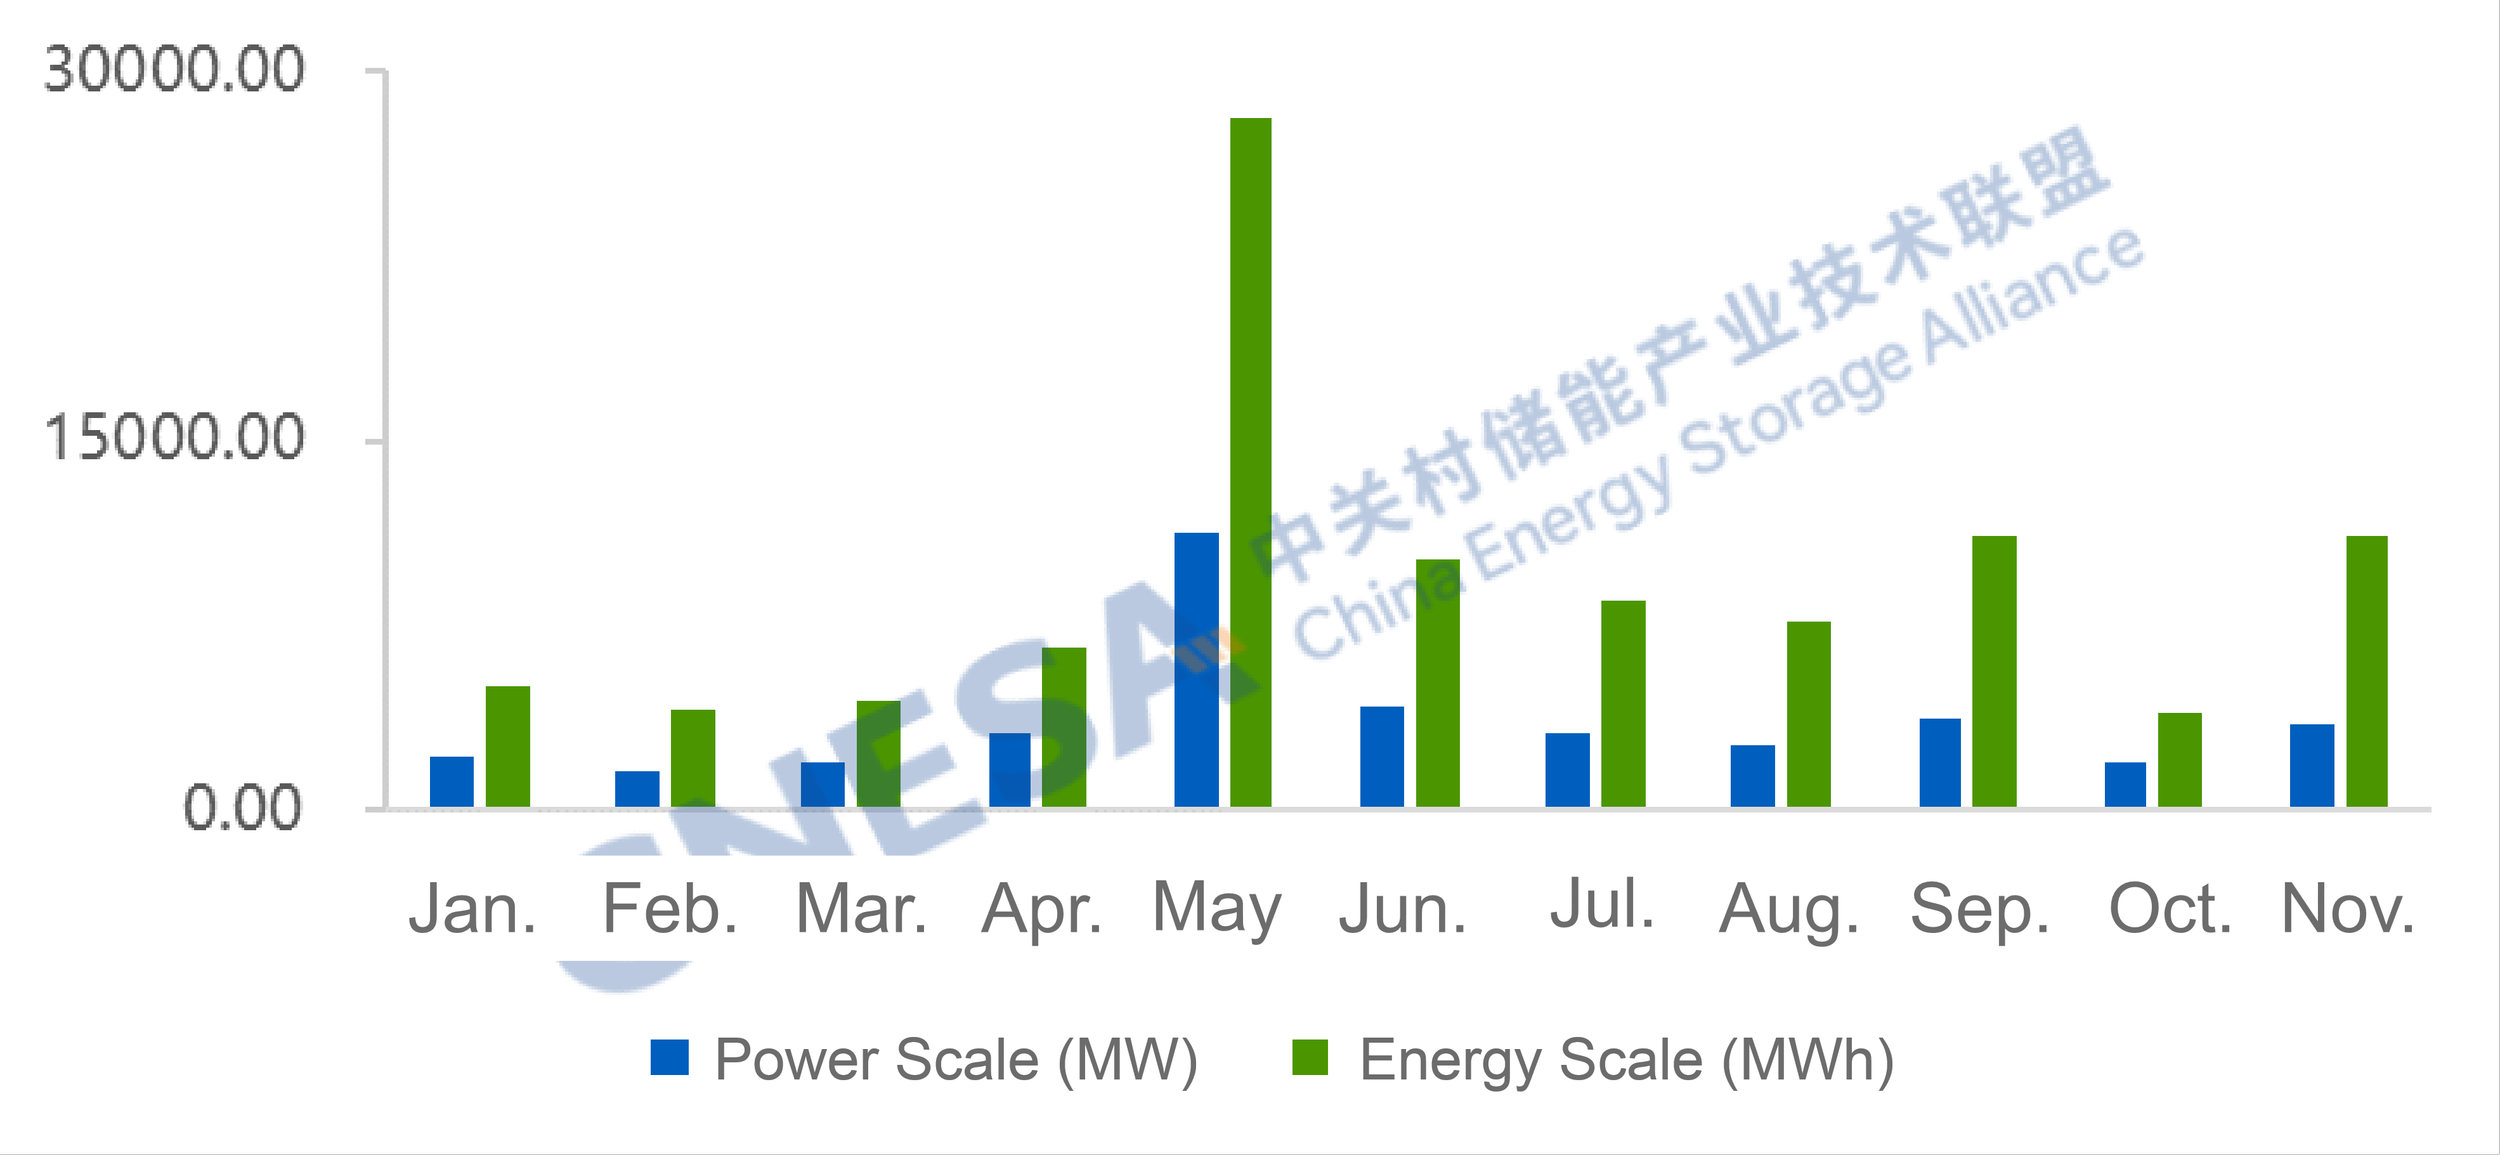
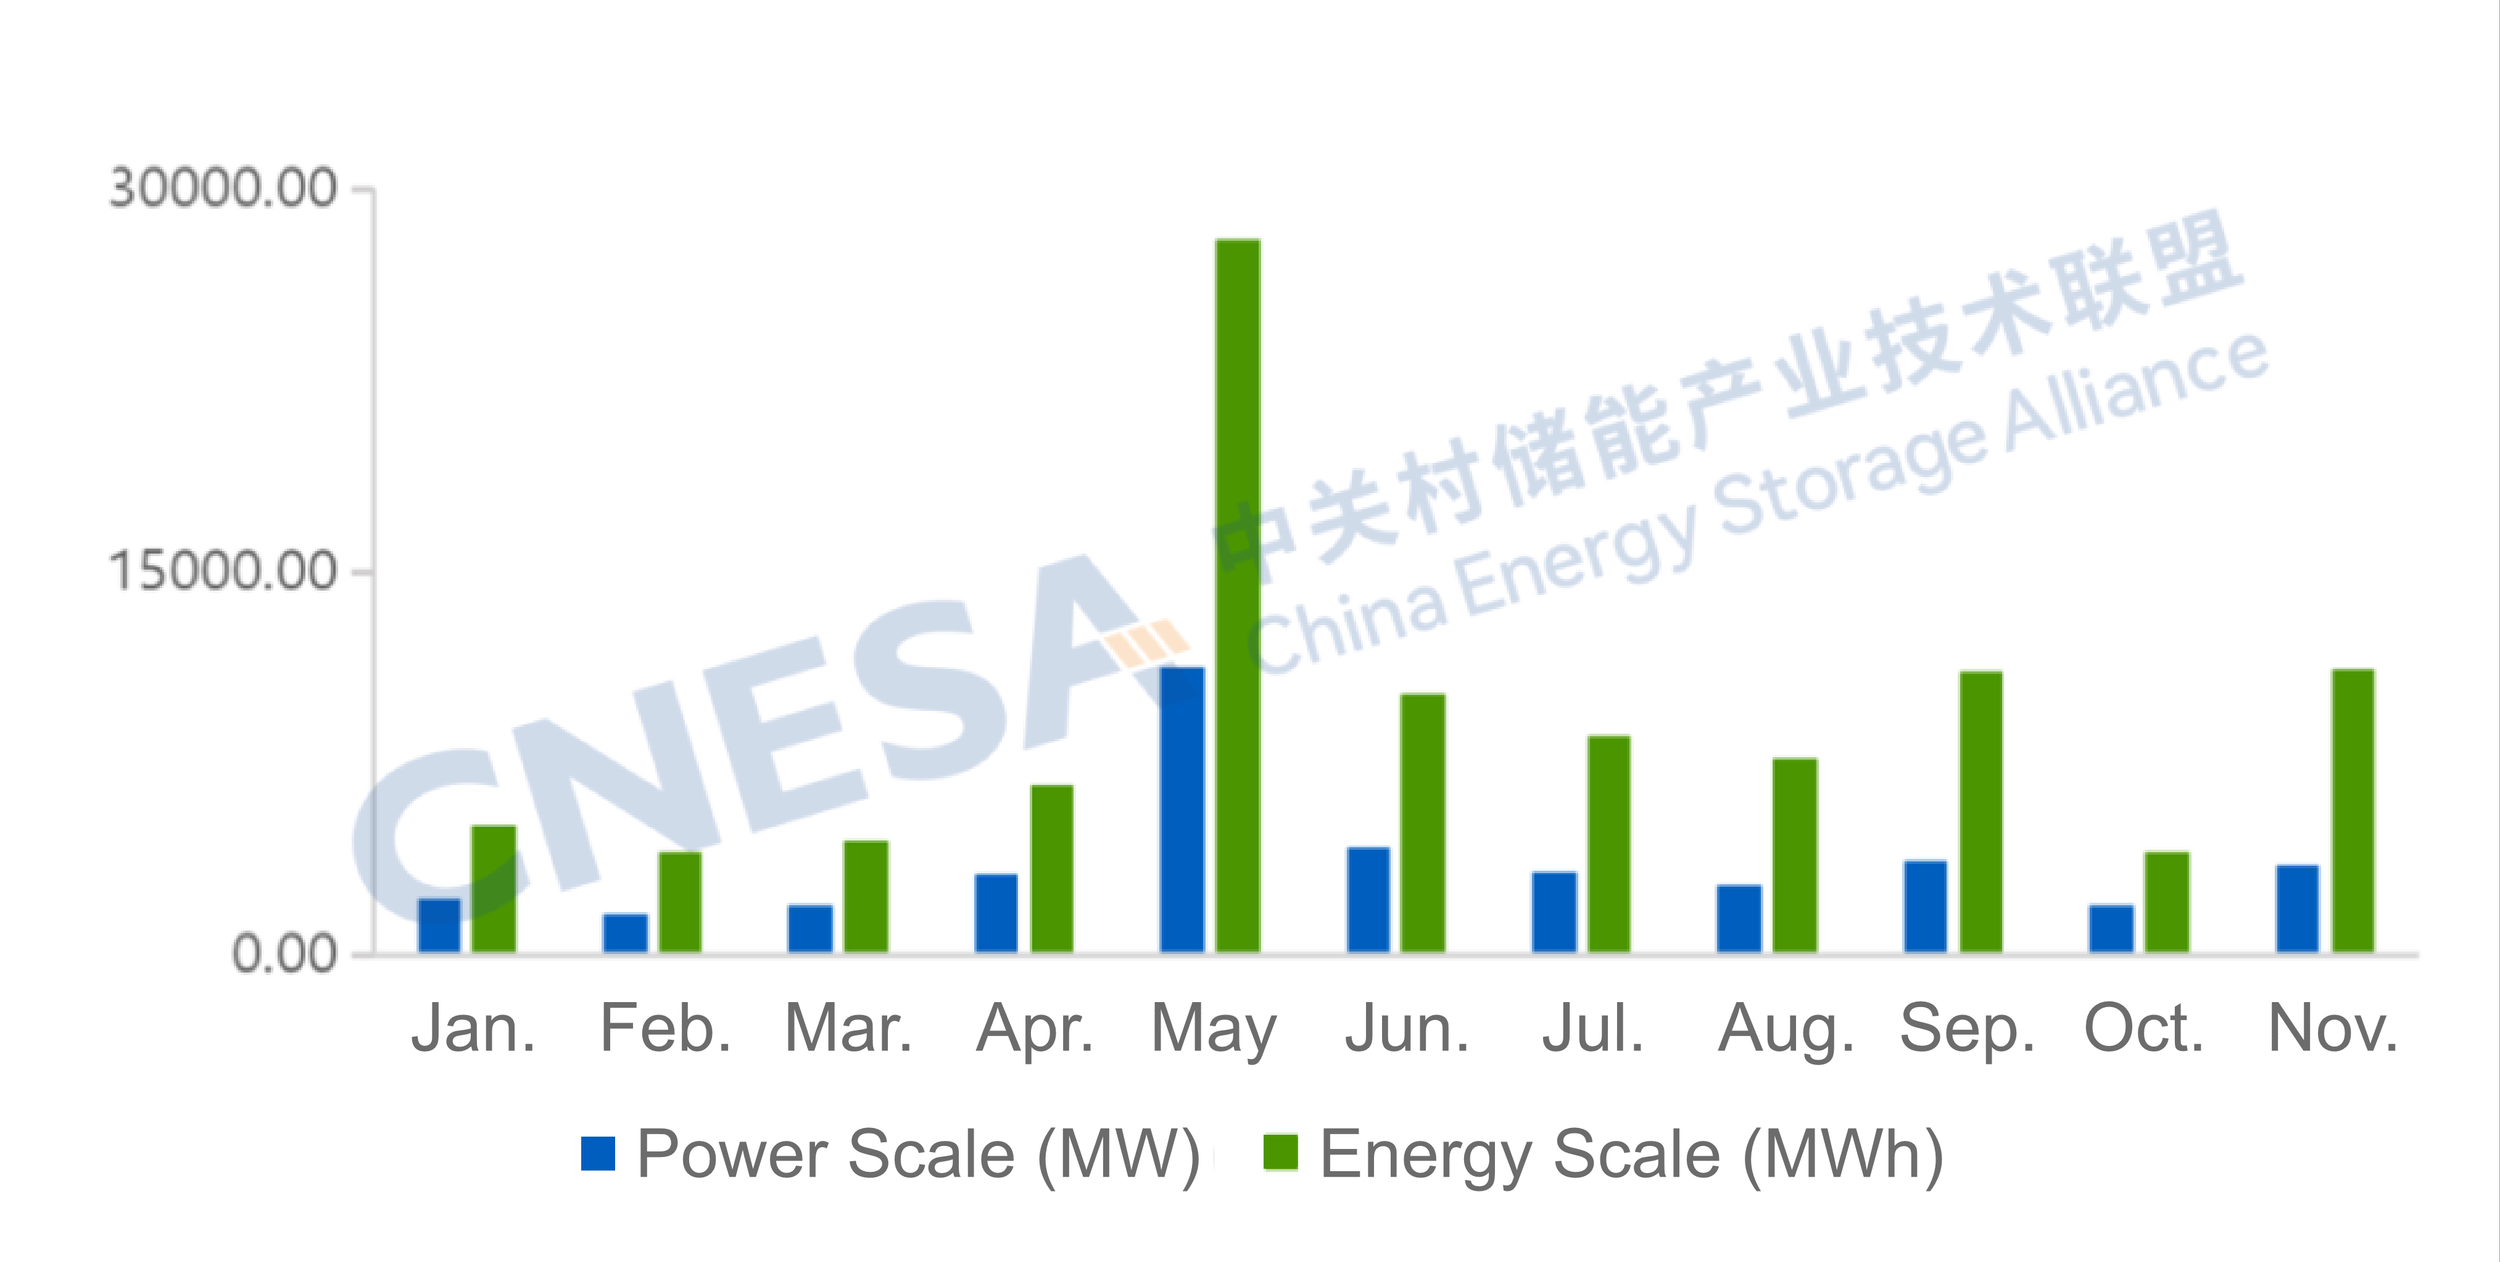
According to incomplete statistics from CNESA, in November 2025, newly commissioned new energy storage projects in China totaled 3.51 GW / 11.18 GWh, representing -22% / -7% year-on-year, and +81% / +180% month-on-month. While monthly additions continued to decline year-on-year, cumulative newly installed capacity in the first eleven months reached 39.5 GW, up 28% year-on-year. Considering the potential for concentrated grid connections ahead of the “12.30” commissioning deadline, total new installations for the year are expected to exceed last year's level.

Figure 4: Installed Capacity of Newly Operating New Energy Storage Projects in China, January - November 2025
Data Source: CNESA DataLink Global Energy Storage Database
https://www.esresearch.com.cn/
Note: Year-on-year comparisons are based on the same period of the previous year; month-on-month comparisons are based on the immediately preceding statistical period.
The China Energy Storage Alliance (CNESA) has consistently adhered to standardized, timely, and comprehensive information collection practices to continuously track developments in energy storage projects. Leveraging its long-term data accumulation and in-depth professional analysis, CNESA regularly publishes objective market analyses on installed energy storage capacity, providing valuable references for industry decision-making. Since June 2025, the monthly energy storage project analysis has been divided into two sections: “Grid&Source-Side Market” and “User-Side Market”. This issue focuses on interpreting the user-side market in November.
CENSA Upcoming Events:
Apr. 1-3, 2026 | The 14th Energy Storage International Conference & Expo
Register Now to attend, free before Dec 31, 2025.

MoM Surge of 90%! Grid&Source-Side Energy Storage Rebounds Sharply in November, with Full-Year Scale Expected to Exceed Last Year
Source: CNESA
After a phase adjustment in China's new-type energy storage market in October 2025, the commissioning scale of new-type energy storage in November declined slightly year on year but rebounded markedly month on month. Meanwhile, the market's deeper structure adjusted compared with October:
Market recovery with a positive long-term outlook: Although installed capacity in November declined year on year, the month-on-month increase was significant. Newly added installations in the first 11 months reached nearly 40 GW, up more than 25% year on year, and full-year additions are expected to exceed last year.
Accelerated deployment of independent storage: In November, independent energy storage accounted for over 70%, with month-on-month growth rates exceeding 80% in power capacity and 200% in energy capacity. Inner Mongolia recorded more than 1.1 GW of newly commissioned independent storage, ranking first nationwide in both power and energy capacity.
Rise of local energy groups: Newly added installations by local energy groups reached a 45% share, surpassing for the first time the “Five Major and Six Minor” power generation groups and the “third-party enterprises”, highlighting a further diversification of market investors.
Faster rollout of diversified technologies: Beyond mainstream lithium batteries, technologies such as compressed air, flow batteries, and flywheels are being deployed at an accelerated pace, supporting the industry's long-term development.
Overall Analysis of New-Type Energy Storage Projects in November
According to incomplete statistics from CNESA, in November 2025 China commissioned a total of 3.51 GW / 11.18 GWh of new-type energy storage projects, representing -22% / -7% year on year and +81% / +180% month on month. While monthly additions continued to decline year on year in November, cumulative additions in the first 11 months reached 39.5 GW, up 28% year on year. Considering potential concentrated grid connections ahead of the “12.30” commissioning deadline, total additions for the year are expected to exceed last year.

Figure 1. Installed Capacity of Newly Commissioned New-Type Energy Storage Projects in China, Jan-Nov 2025
Data source: CNESA DataLink Global Energy Storage Database
https://www.esresearch.com.cn/
Note: Year-on-year (YoY) compares the same period last year; month-on-month (MoM) compares the previous statistical period.
Analysis of Grid&Source-Side New-Type Energy Storage Projects in November
In November, newly added grid&source-side installations totaled 3.32 GW / 10.62 GWh, -15% / -1% year on year and +90% / +202% month on month.
Key characteristics include:
Newly added Independent storage accounted for 72%, down 6 percentage points from October.
Independent storage additions reached 2.41 GW / 8.19 GWh, -9% / +11% year on year and +82% / +217% month on month, with projects of 100 MW or above accounting for 79% by number.
Power-generation-side additions were 853.3 MW / 2,322.1 MWh, -33% / -31% year on year and +99% / +148% month on month. Renewable-plus-storage projects accounted for 98% of power capacity, covering multiple application scenarios such as UHV DC projects, agrivoltaics, and pastoral-solar hybrid systems.
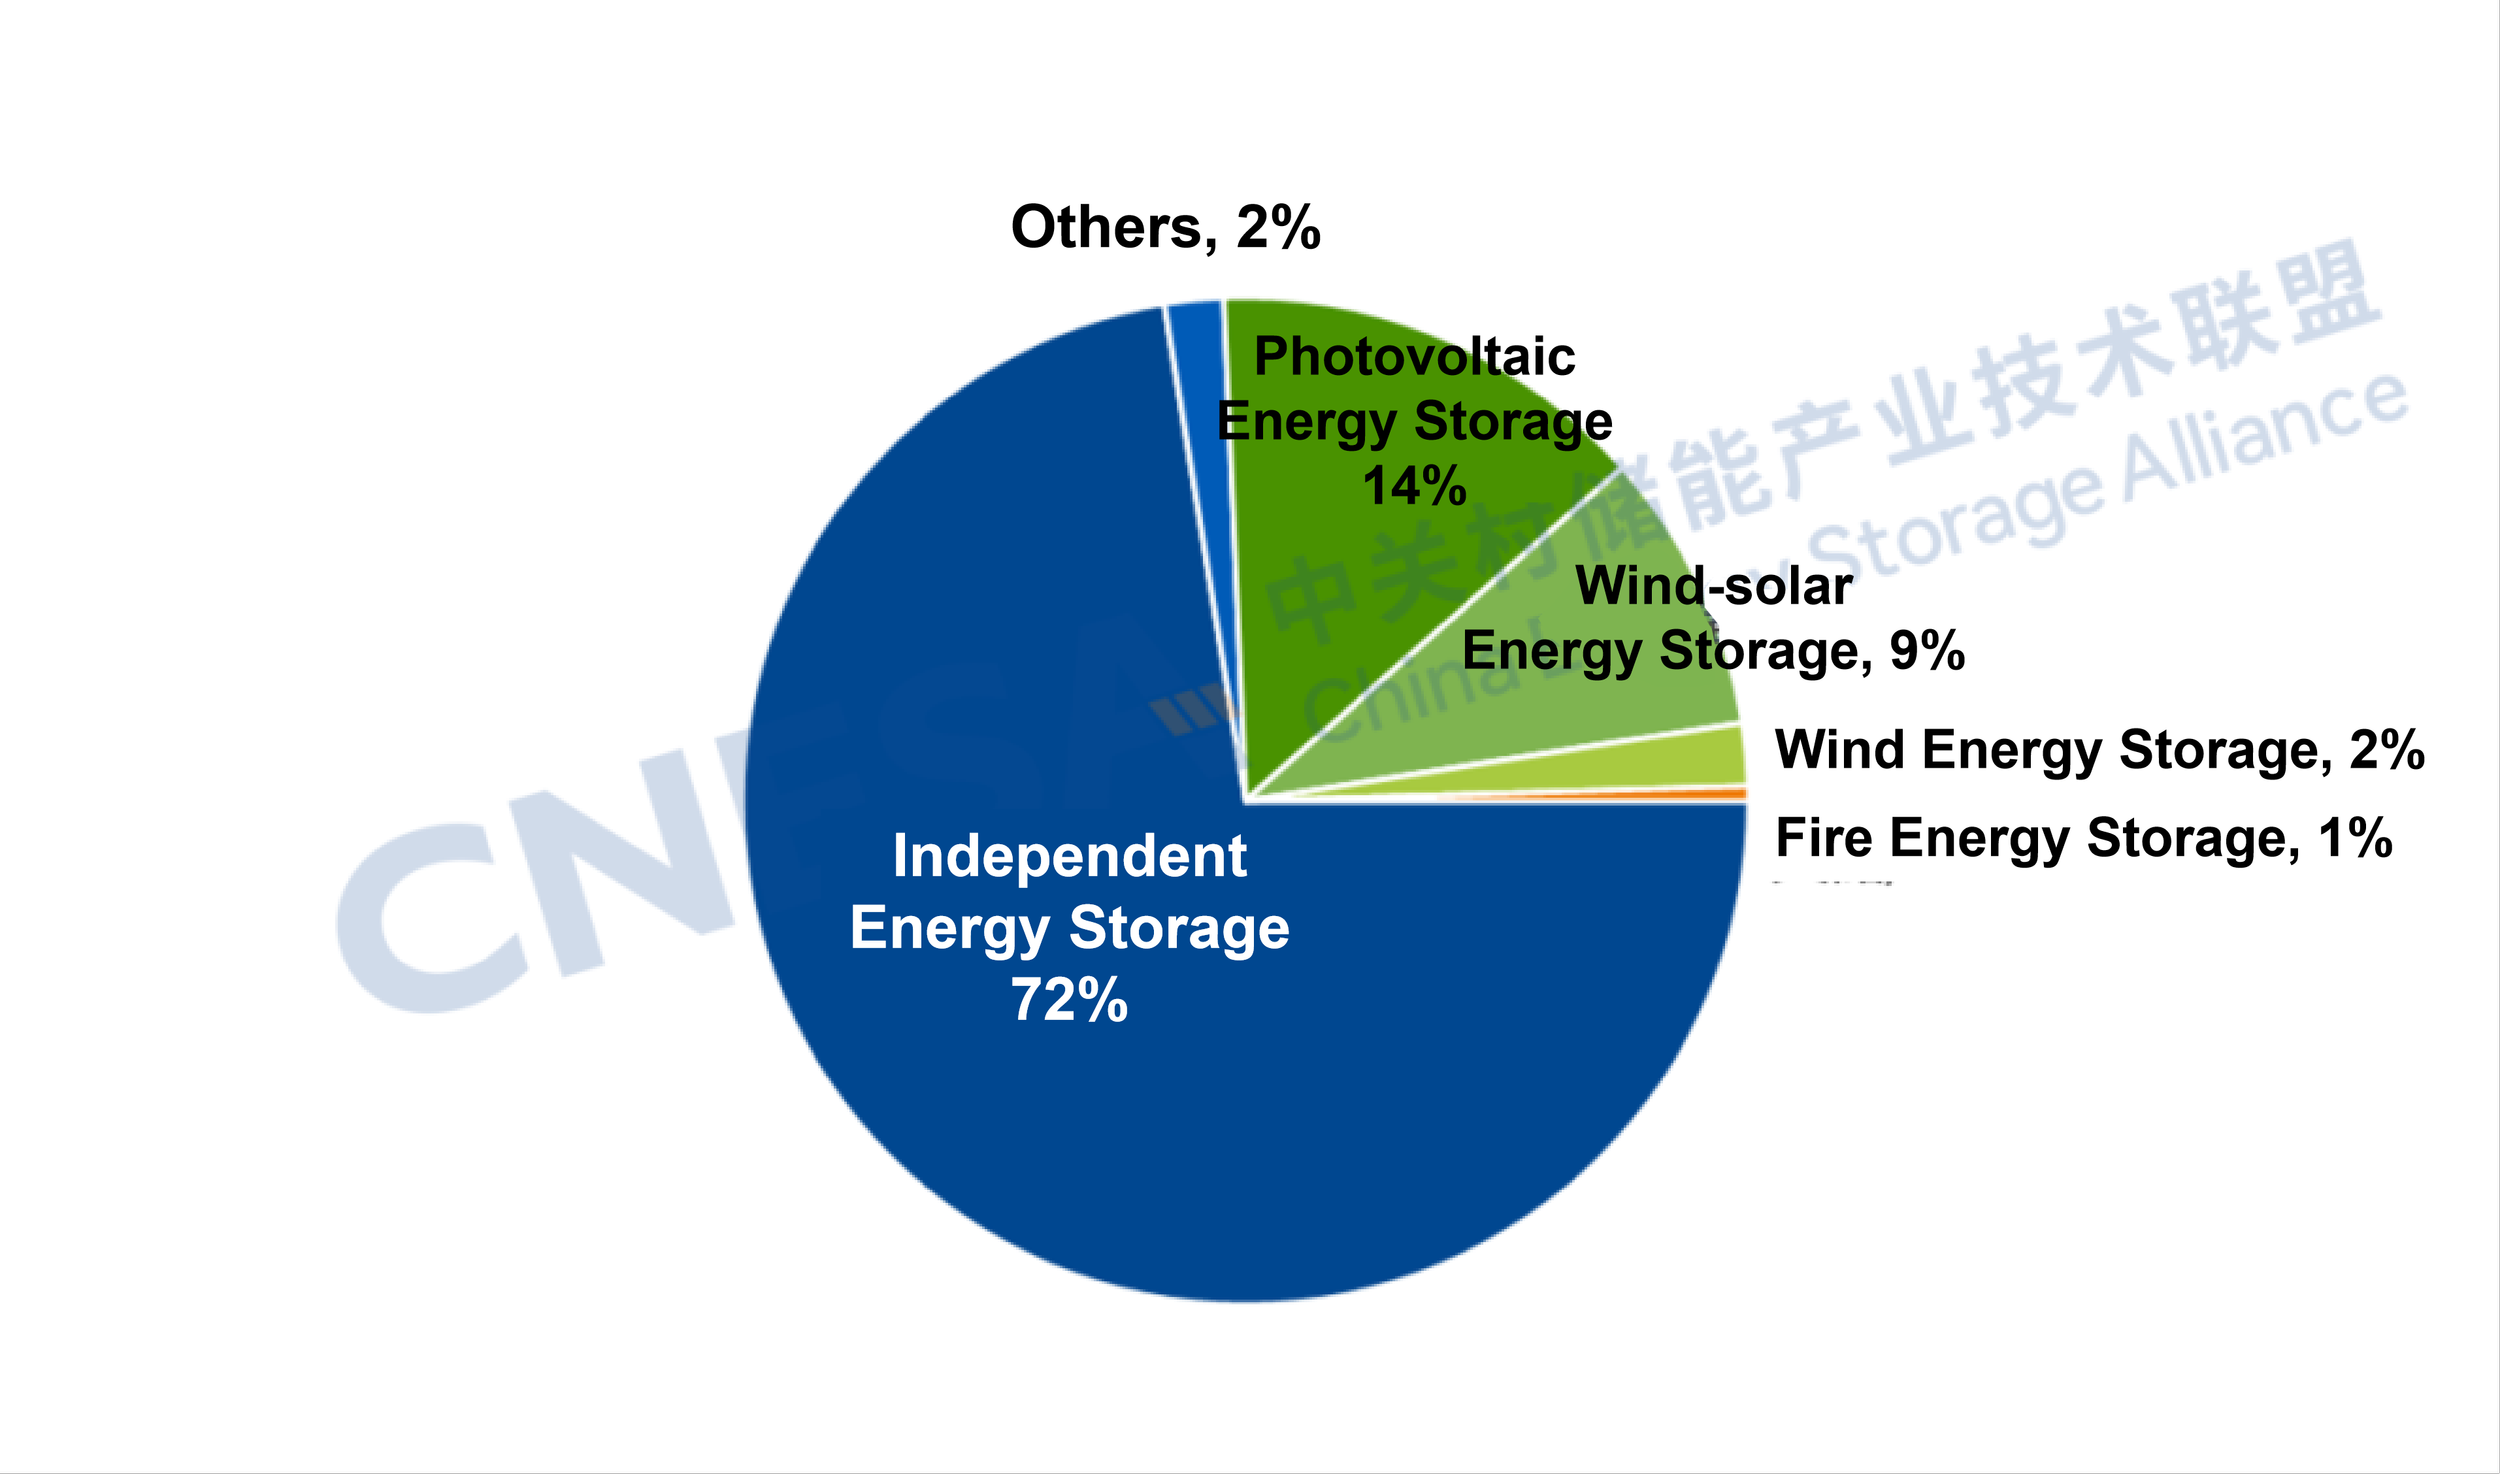
Figure 2. Application Breakdown of Newly Commissioned Grid&Source-Side Energy Storage Projects in Nov. 2025 (MW%)
Data source: CNESA DataLink Global Energy Storage Database
https://www.esresearch.com.cn/
Note: “Others” include substations, emergency power supply, etc.
Northwest Leads with Over 40% Share; Inner Mongolia Ranks First
In November, the Northwest region accounted for 43% of newly added capacity, ranking first nationwide. Combined additions in the Northwest and Southwest exceeded half of the national total.
By province, the Inner Mongolia Autonomous Region saw multiple Independent grid-side demonstration projects commissioned - such as those included in the 2025 New-Type Energy Storage Special Action Implementation Project List and the first batch of Independent storage construction projects - totaling over 1.1 GW with an average storage duration of 4 hours, ranking first nationwide in both power and energy capacity. Xinjiang, Gansu, and Ningxia followed closely.
As a key national energy and strategic resource base in China, Inner Mongolia had surpassed 150 GW of installed renewable capacity by the end of October 2025, ranking first nationwide. Wind and solar accounted for over 80% of new installed capacity, further solidifying their dominant role (data source: Inner Mongolia Autonomous Region Energy Bureau). From the perspective of consumption, approximately 80% of renewable generation is consumed locally, with around 20% exported. The combined pressure of local consumption and grid stabilization continues to drive demand for new-type energy storage.
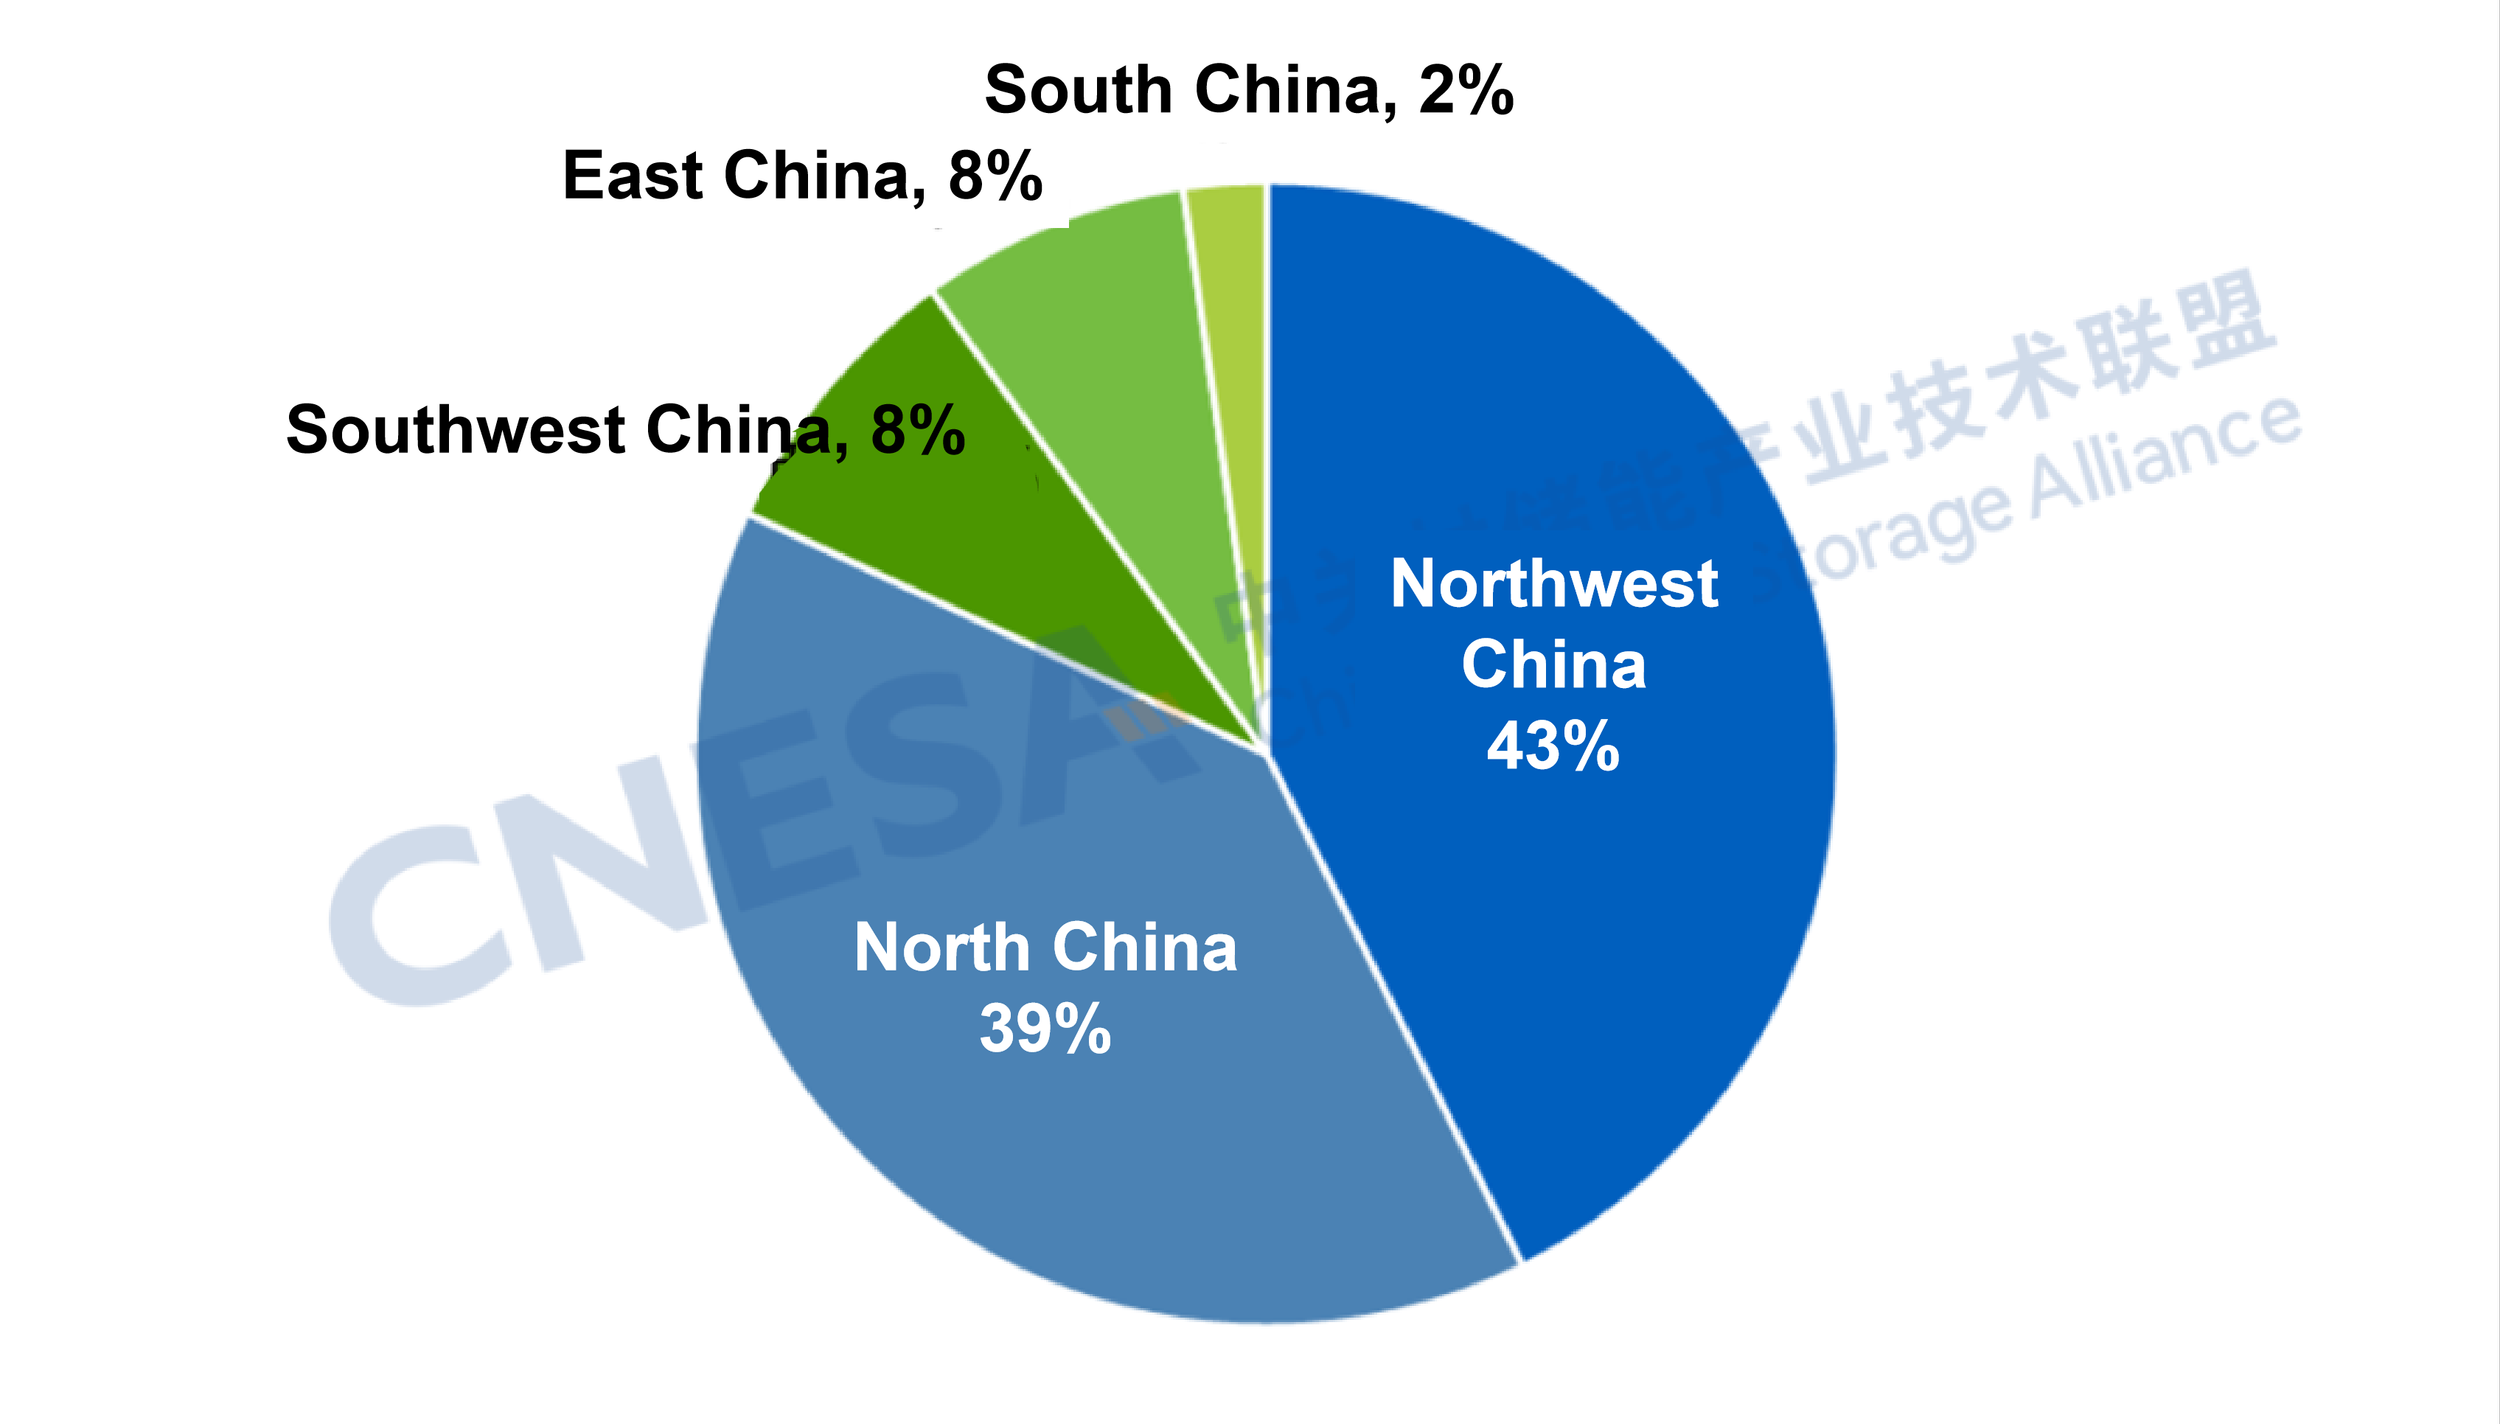
Figure 3. Regional Distribution of Newly Commissioned Grid&Source-Side Energy Storage Projects in China, November 2025 (MW%)
Source: CNESA Datalink Global Energy Storage Database
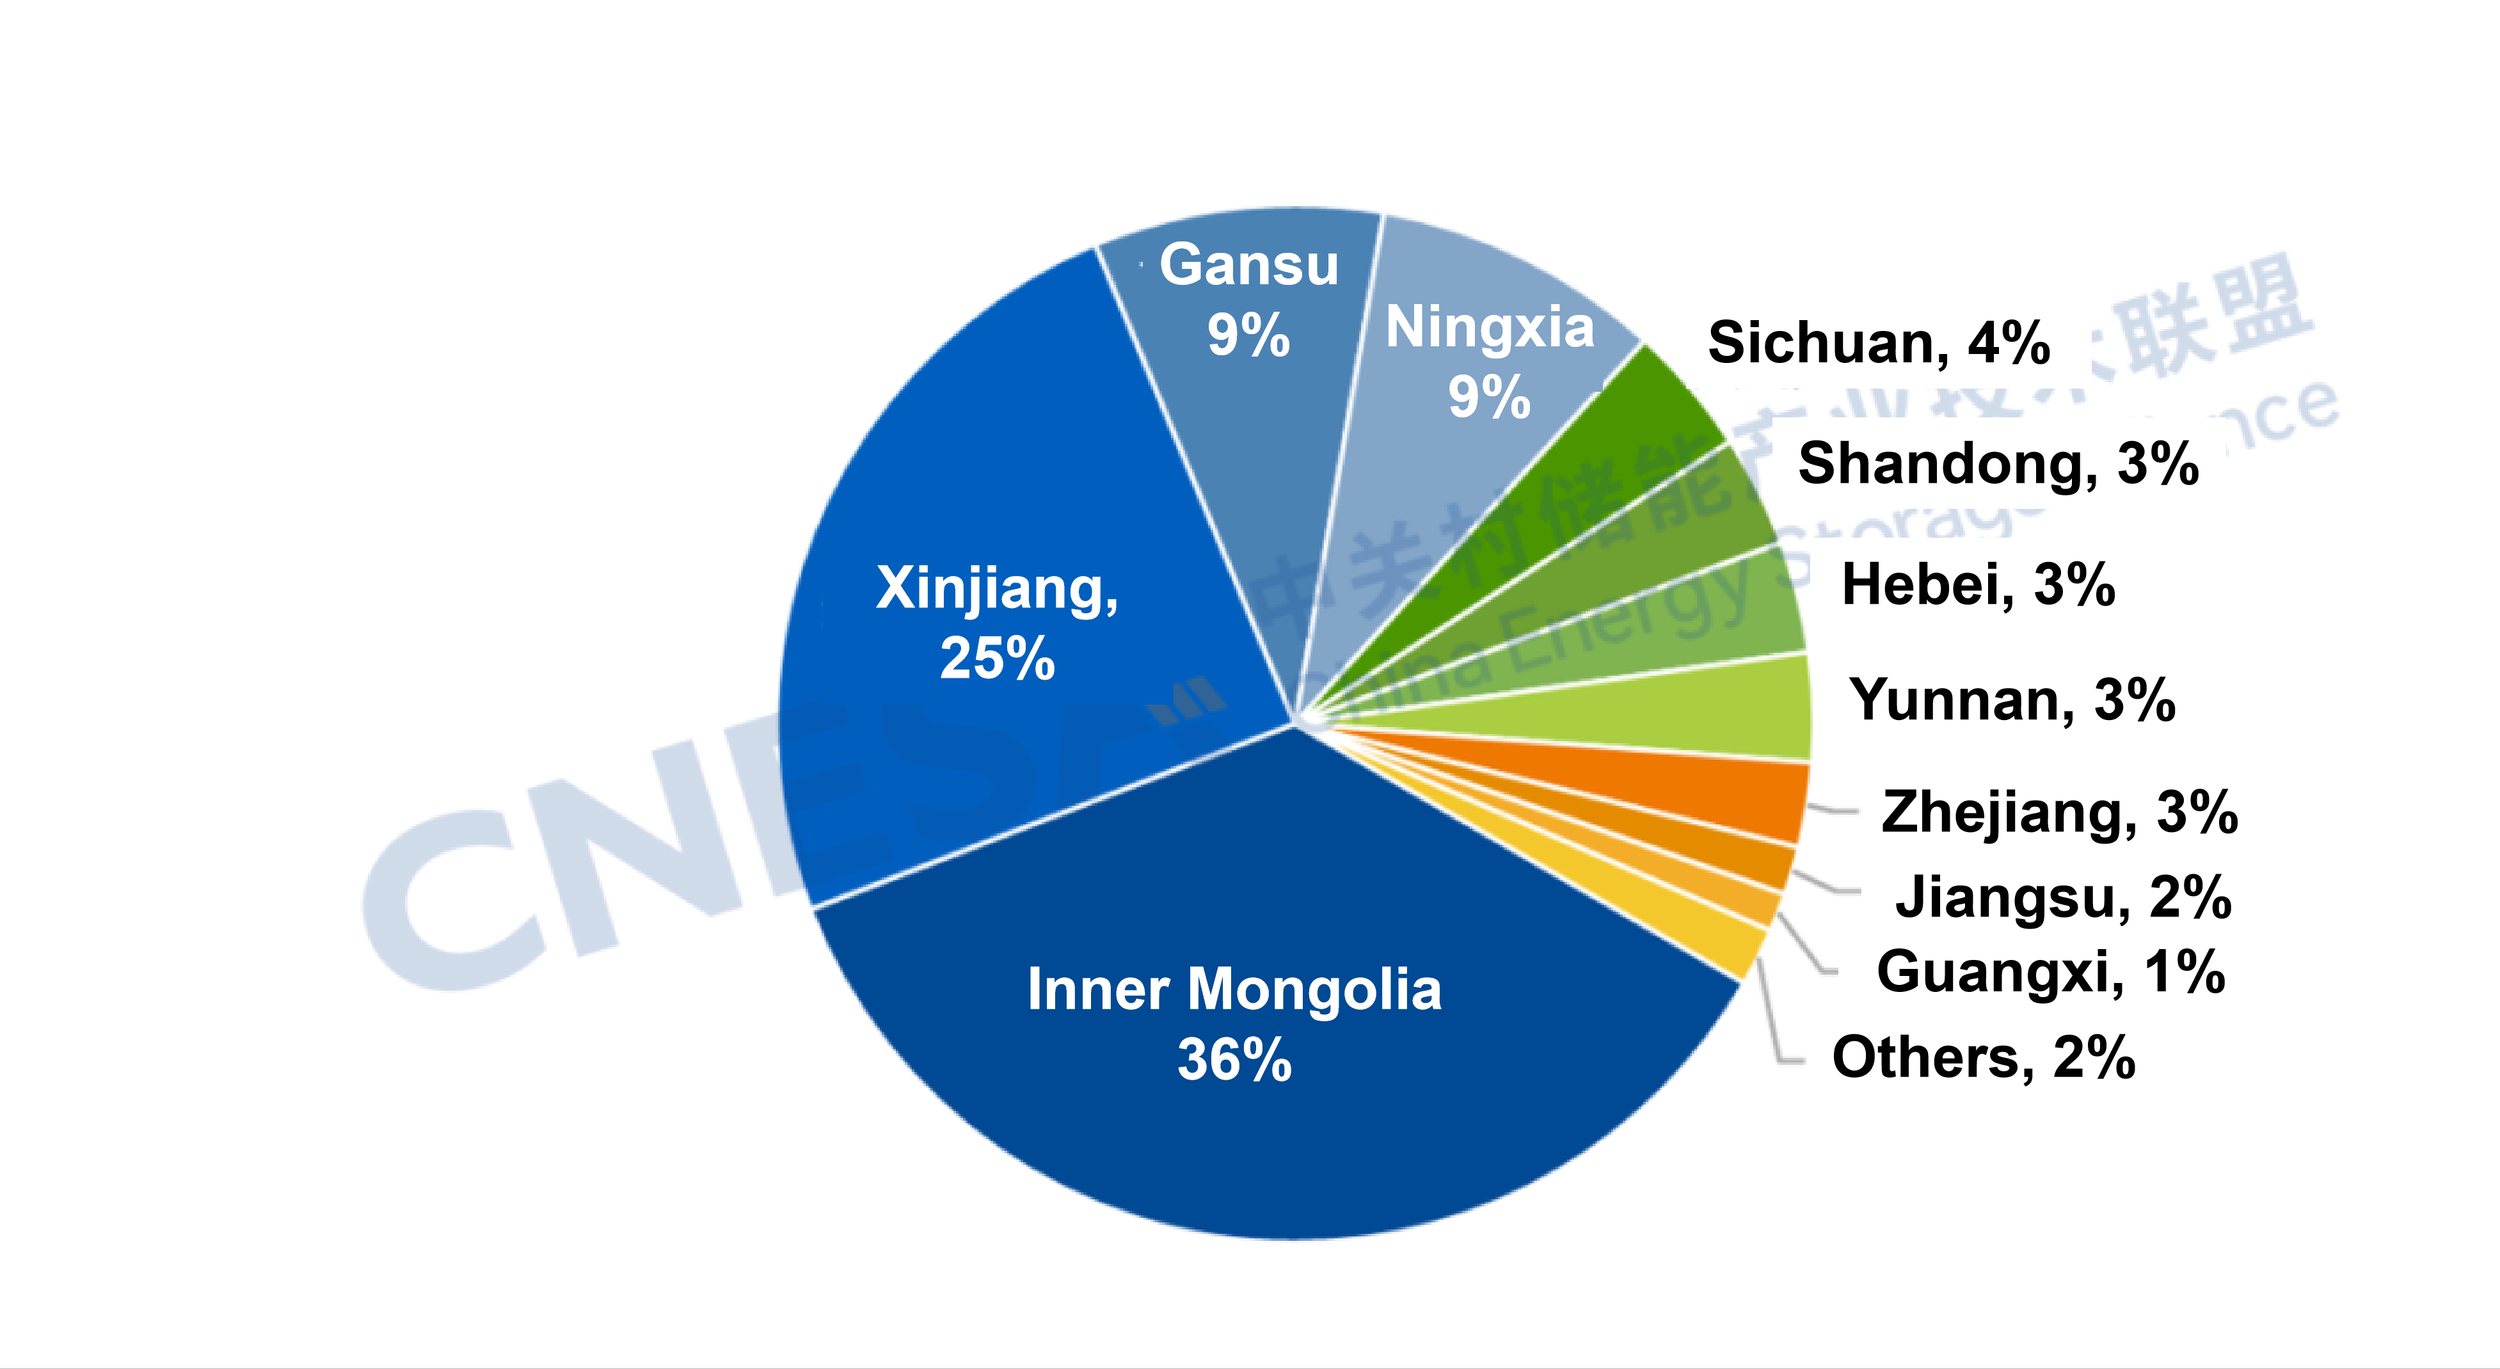
Figure 4. Provincial Distribution of Newly Commissioned Grid&Source-Side Energy Storage Projects in China, November 2025 (MW%)
Source: CNESA Datalink Global Energy Storage Database
https://www.esresearch.com.cn/
Faster Deployment by Local Energy Groups Highlights Investor Diversification
Driven by rising market demand, supportive national policies, diversified technology pathways, and declining costs, the market potential of energy storage is being fully released, with increasing investor diversification.
In November, projects invested in and built by local energy groups such as Xinjiang Energy Group, Xinjiang Zhongyuan Power Group, and Shenergy Group were commissioned in succession. Local energy groups accounted for 45% of newly added power capacity - the highest among all enterprise types - contrasting sharply with September and October, when third-party enterprises and the “Five Major and Six Minor” power generation groups dominated.
Leveraging advantages in policy coordination and approvals, resource integration and location, business linkage and industrial chain synergy, capital strength and decision-making efficiency, and operations, local energy groups have become a key pillar of the new-type energy storage market. Meanwhile, third-party enterprises - such as joint entities involving Conch New Energy and CATL, and Inner Mongolia Zhongdian Energy Storage - maintained a high level of participation, accounting for over 30% of monthly additions. The “Five Major and Six Minor” power generation groups (including China Huaneng, SPIC, and China Huadian) accounted for 22%, down 9 percentage points from October, continuing the decline seen since August.
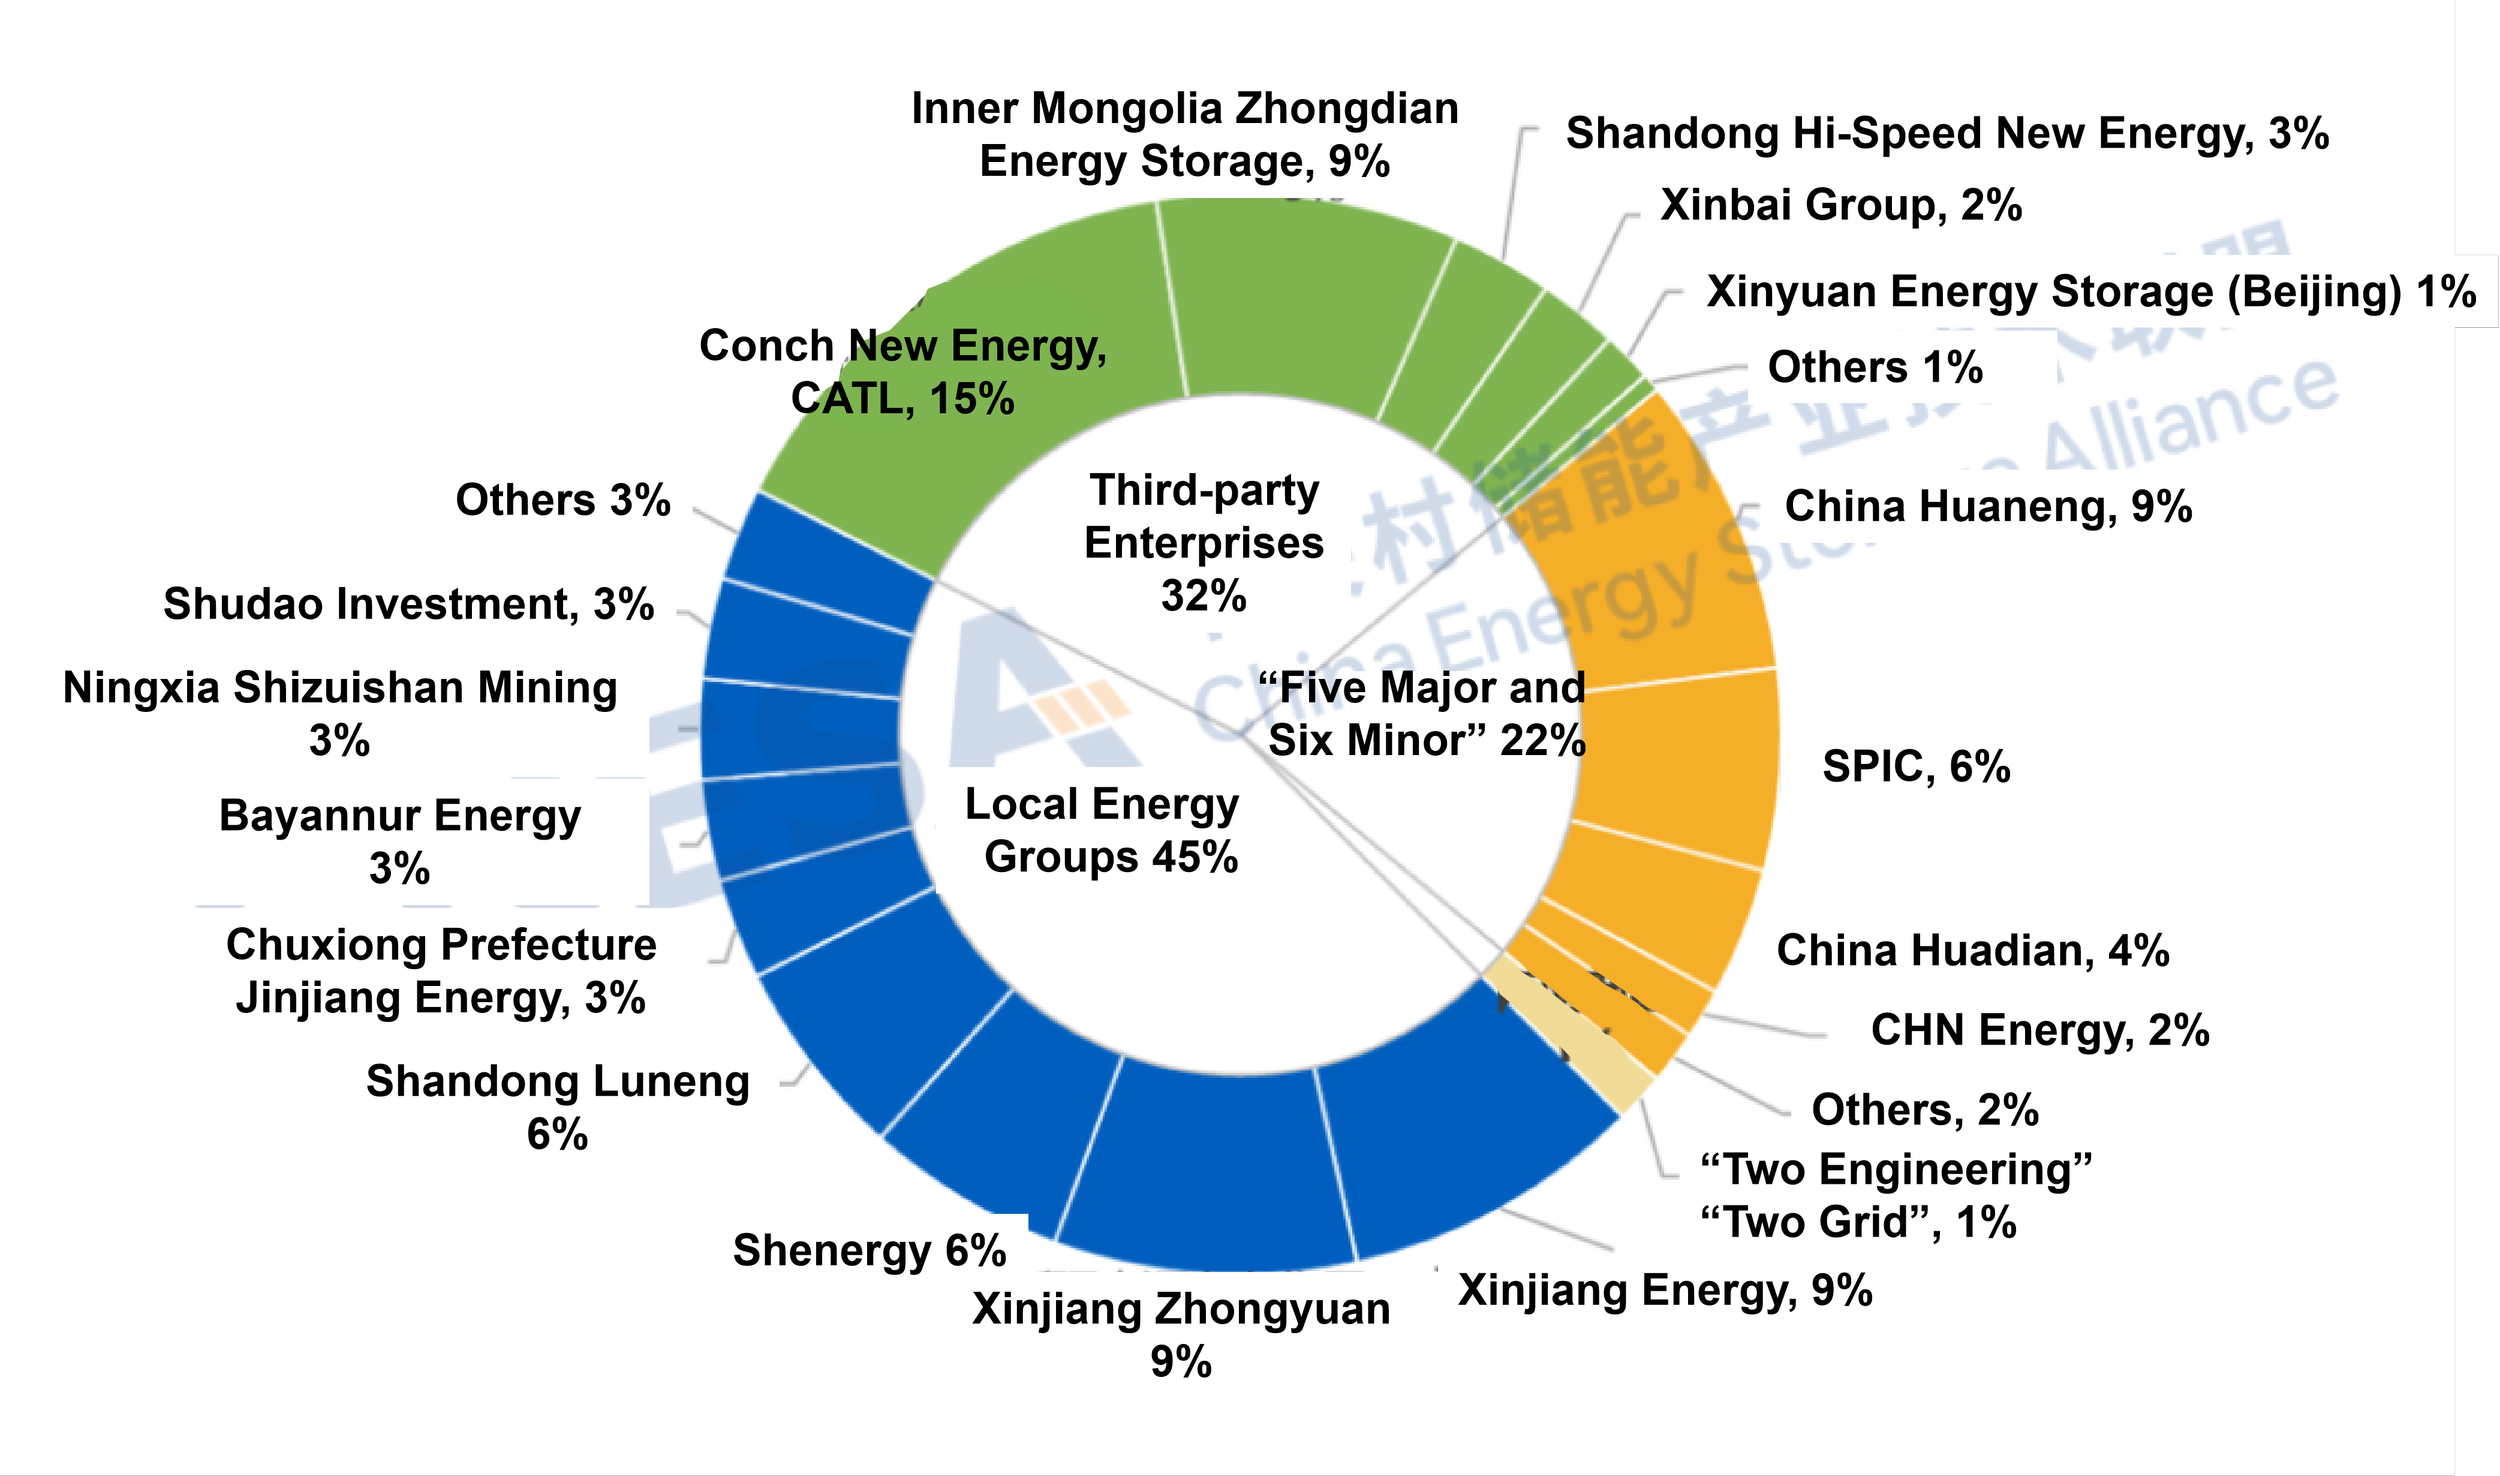
Figure 5. Owner Distribution of Newly Commissioned Grid&Source-Side Energy Storage Projects in China, November 2025 (MW%)
Data source: CNESA DataLink Global Energy Storage Database
https://www.esresearch.com.cn/
Note: “Third-party enterprises” refer to entities other than large state-owned generation groups, the two grid companies, two construction groups and local energy companies.
Accelerated Deployment of Non-Lithium Technologies
Technologically, newly commissioned grid&source-side projects were dominated by lithium iron phosphate (LFP) batteries, accounting for 91% of power capacity, followed by lead-carbon batteries (6%) and flow batteries (3%).
From a project development perspective, non-lithium technologies such as compressed air energy storage and hybrid systems are accelerating, highlighting a trend toward diversified technology pathways.
In compressed air storage, multiple 300 MW-class projects have completed filings and entered the planning stage; the Golmud 60 MW liquid air energy storage demonstration project and the Yumen 300 MW compressed air energy storage demonstration project have entered commissioning.
For hybrid storage, multiple 100 MW-class demonstration projects have launched or completed tenders, with some under construction or advancing, involving combinations such as lithium + sodium-ion batteries, lithium + flow batteries, lithium + flywheels, and lithium + nickel-metal hydride batteries.
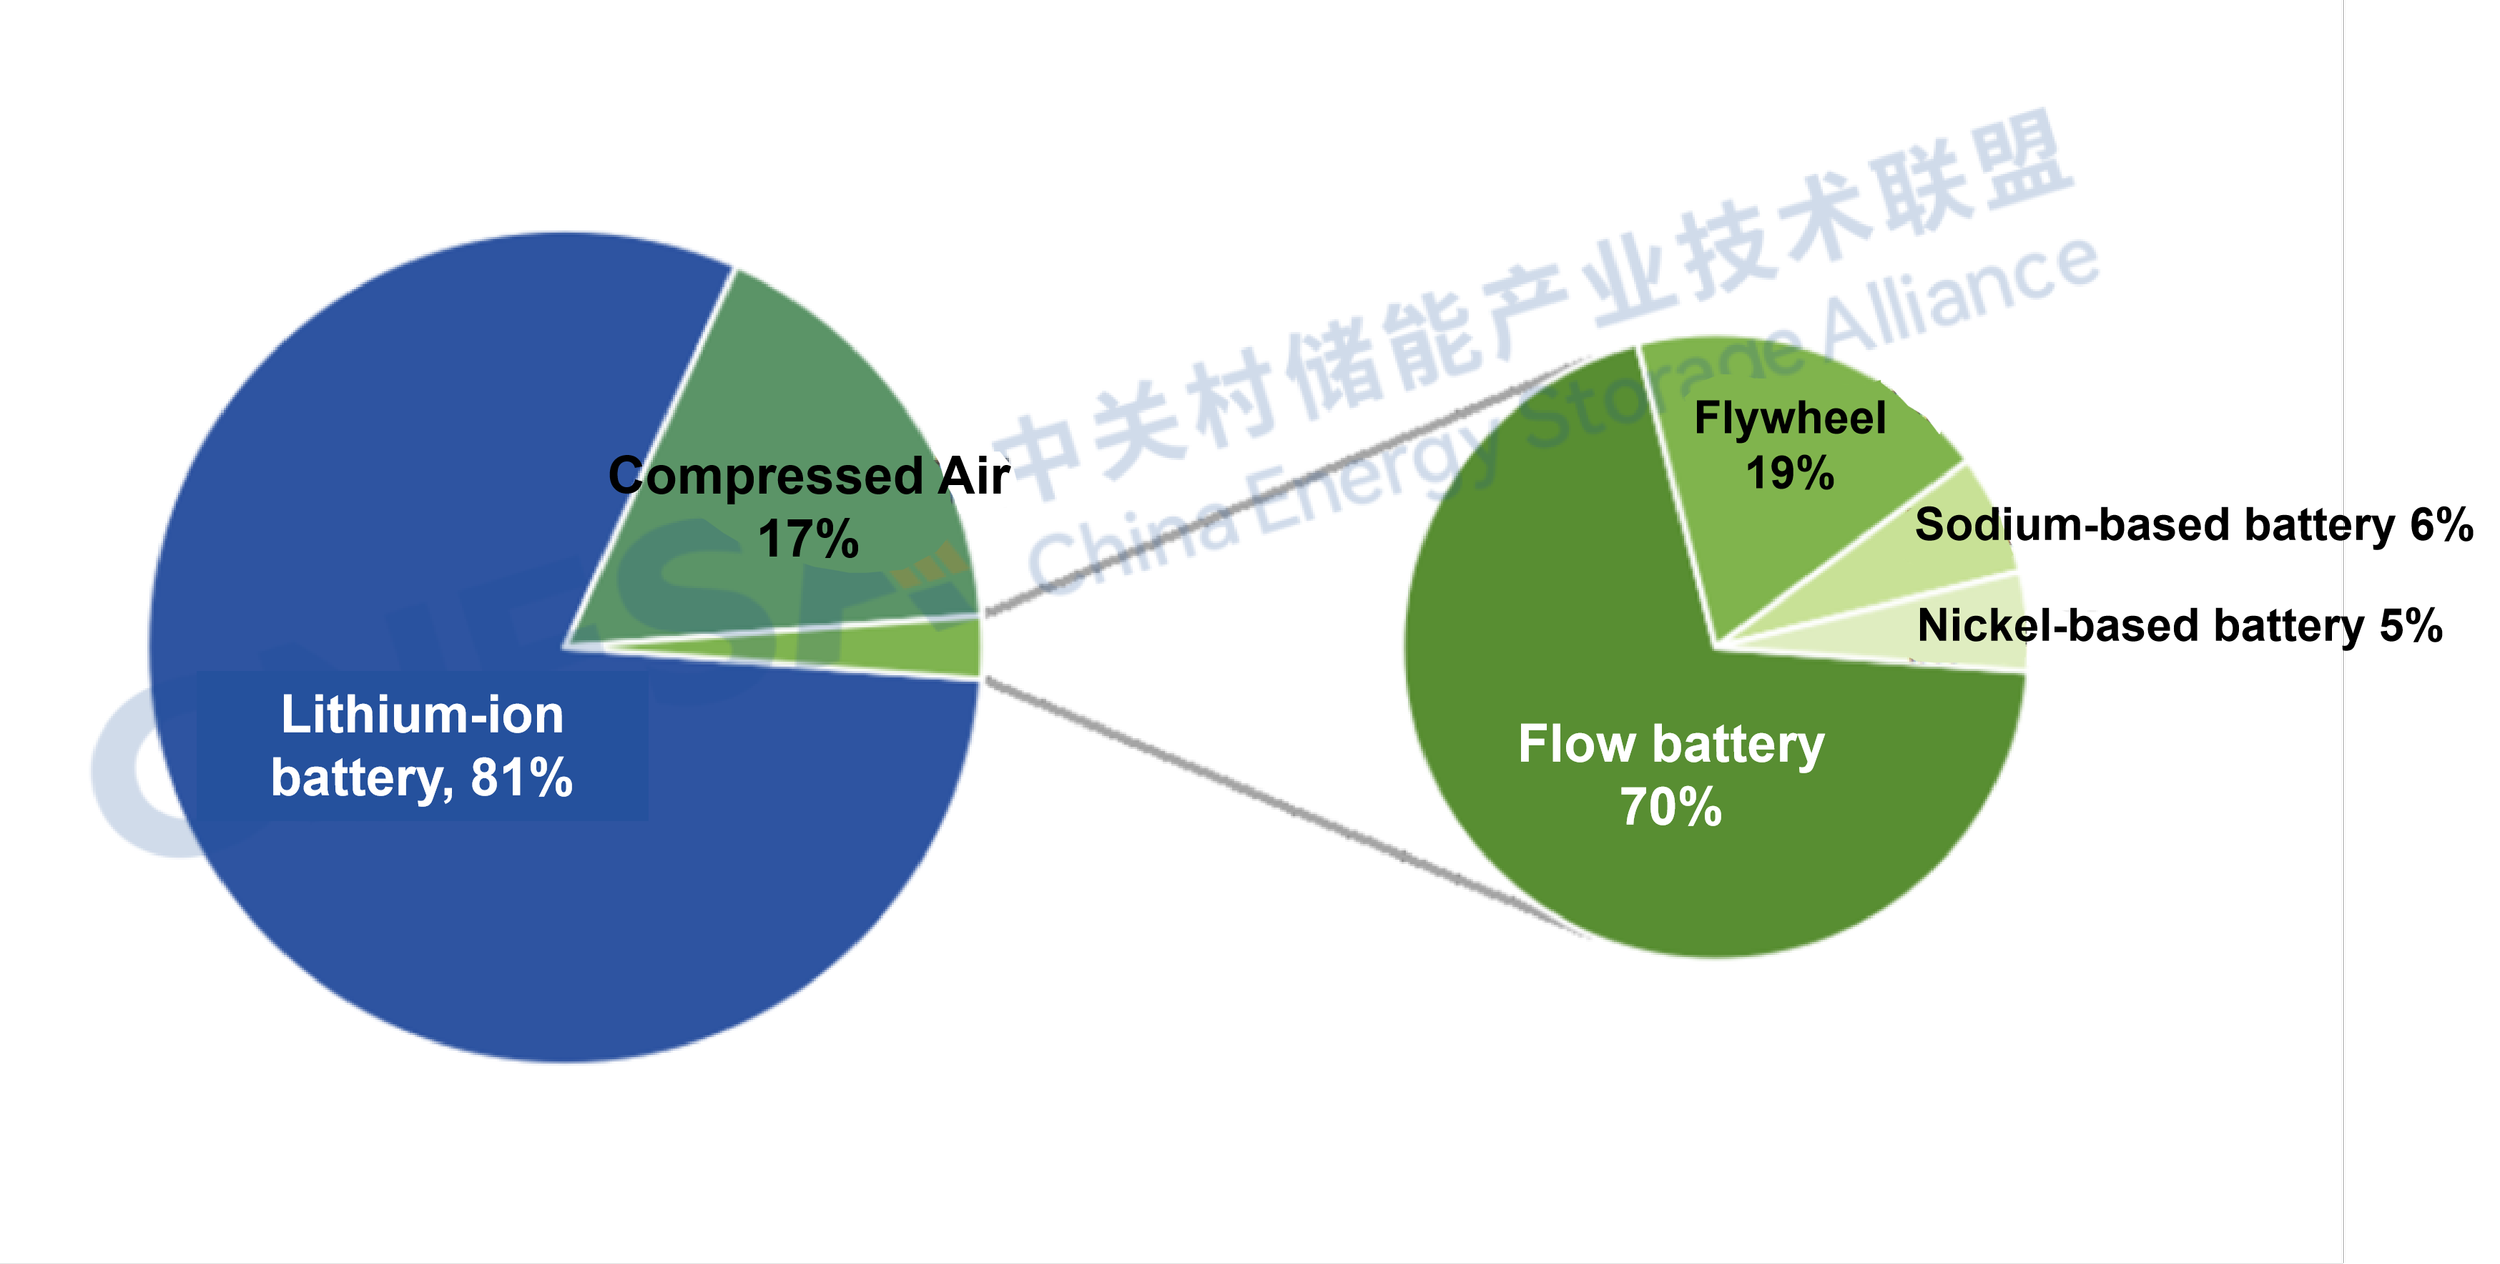
Figure 6. Technology Distribution of Newly Planned and Under-Construction Grid&Source-Side Energy Storage Projects in China, November 2025 (MW%)
Source: CNESA Datalink Global Energy Storage Database
https://www.esresearch.com.cn/
The China Energy Storage Alliance (CNESA) has consistently adhered to standardized, timely, and comprehensive information collection practices to continuously track developments in energy storage projects. Leveraging its long-term data accumulation and in-depth professional analysis, CNESA regularly publishes objective market analyses on installed energy storage capacity, providing valuable references for industry decision-making. Since June 2025, the monthly energy storage project analysis has been divided into two sections: “Grid&Source-Side Market” and “User-Side Market”. This issue focuses on interpreting the grid&source-side market in November.
CENSA Upcoming Events:
Apr. 1-3, 2026 | The 14th Energy Storage International Conference & Expo
Register Now to attend, free before Dec 31, 2025.

Sign up for our free monthly newsletter to stay informed about the Chinese energy storage market.