

Latest News
User-side Newly Commissioned Capacity Down 34% YoY, Henan Leads in New Additions — Analysis of User-side Energy Storage Projects in October
Source: CNESA
The China Energy Storage Alliance (CNESA) continues to adhere to standardized, timely, and comprehensive information collection criteria, tracking energy storage project developments on an ongoing basis. Leveraging its long-accumulated solid database and in-depth industry expertise, CNESA regularly publishes objective analytical reports on the energy storage installation market, providing valuable references for industry stakeholders. Given the distinct differences between grid-side and user-side energy storage markets, CNESA has, since June 2025, divided its monthly project analysis into two separate reports: grid-side market and user-side market. This edition focuses on the user-side market performance in October.
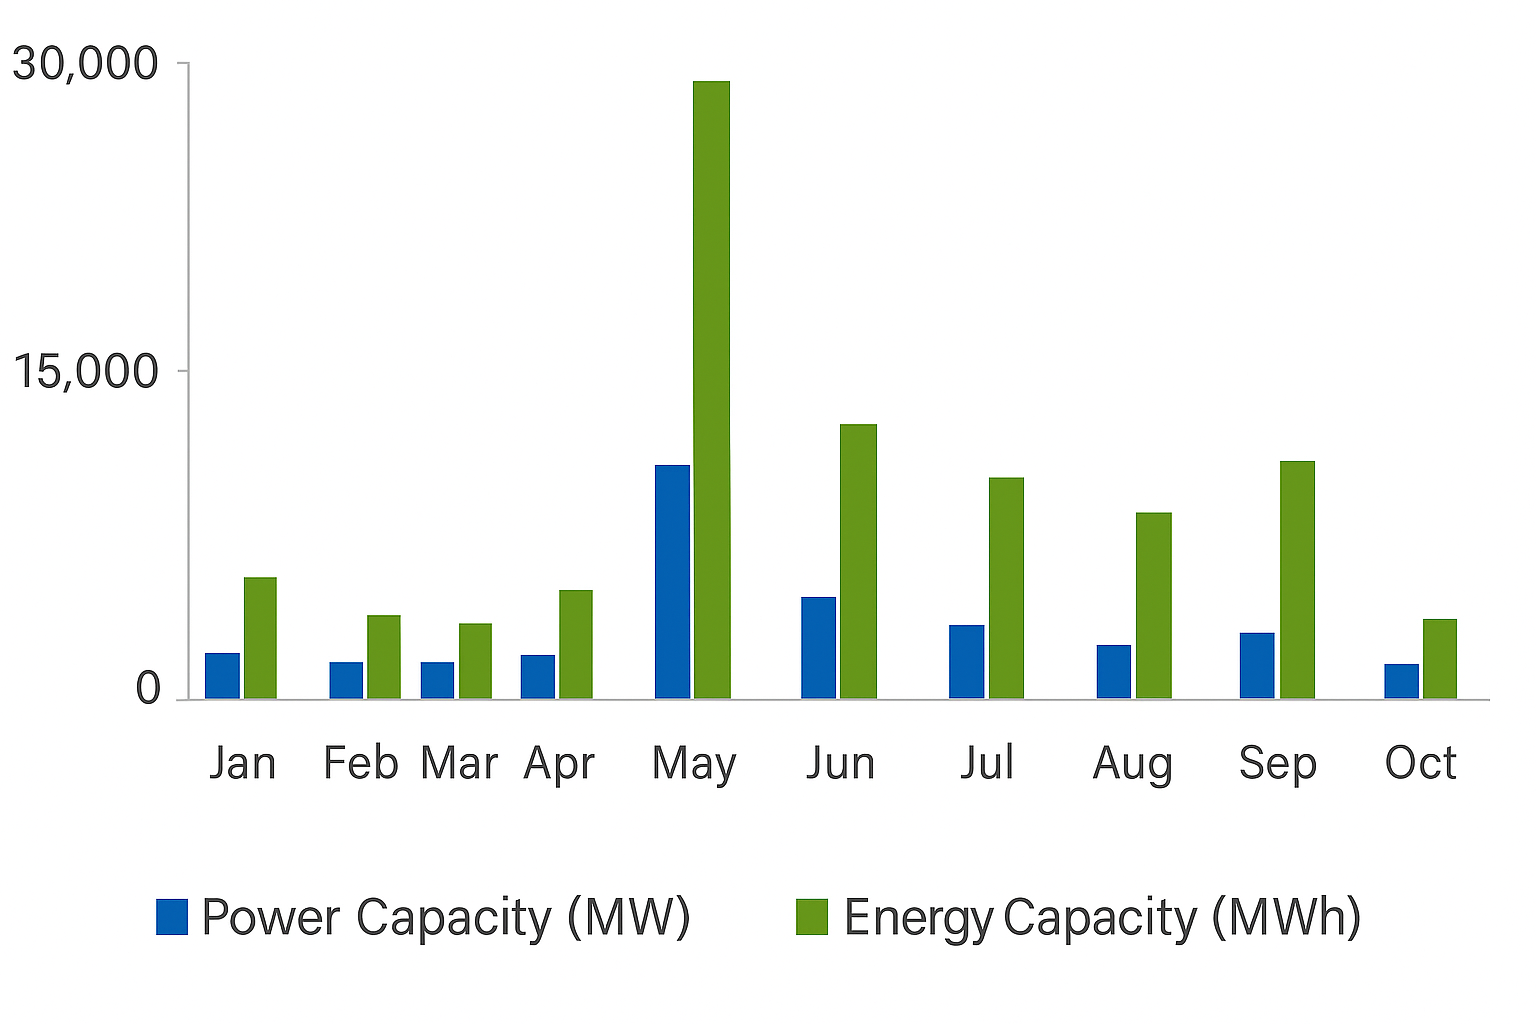
According to CNESA’s preliminary statistics, in October 2025, newly commissioned new-type energy storage capacity in China reached 1.70 GW / 3.52 GWh, representing a year-on-year decline of 35% and 49%, and a month-on-month decline of 51% and 66%, respectively.
Although new installations in the first month of Q4 decreased, cumulative new user-side installations from January to October have reached 35.8 GW, a year-on-year increase of 36%. Following a mini-peak of project commissioning in September, October saw a decline due mainly to project construction cycle constraints.

Figure 1: Installed Capacity of Newly Commissioned New-type Energy Storage Projects in China (January–October 2025)
Data Source: CNESA DataLink Global Energy Storage Database
Website: https://www.esresearch.com.cn/
Note: “Year-on-year (YoY)” compares with the same period last year; “month-on-month (MoM)” compares with the immediately preceding statistical period.
In October, user-side new installations reached 193.45 MW / 474.64 MWh, representing a year-on-year decline of 34% and 48%, and a month-on-month decline of 30% and 17%, respectively. User-side new-type energy storage installations in October demonstrated the following characteristics:
(1) C&I storage dominates; non-lithium technologies are accelerating their deployment.
In October, the user-side storage market was dominated by commercial and industrial (C&I) applications, accounting for over 90% of total new installations.
C&I scenarios added 178.00 MW / 445.19 MWh, down 39% and 51% year-on-year.
From a technology perspective, all newly commissioned projects adopted electrochemical energy storage technologies. LFP (lithium iron phosphate) batteries accounted for 99% of the newly installed power capacity. In terms of non-lithium technologies, a 2 MW / 8 MWh C&I all-vanadium flow battery project was completed and commissioned, alongside a hybrid LFP + vanadium flow battery demonstration project that also came online.
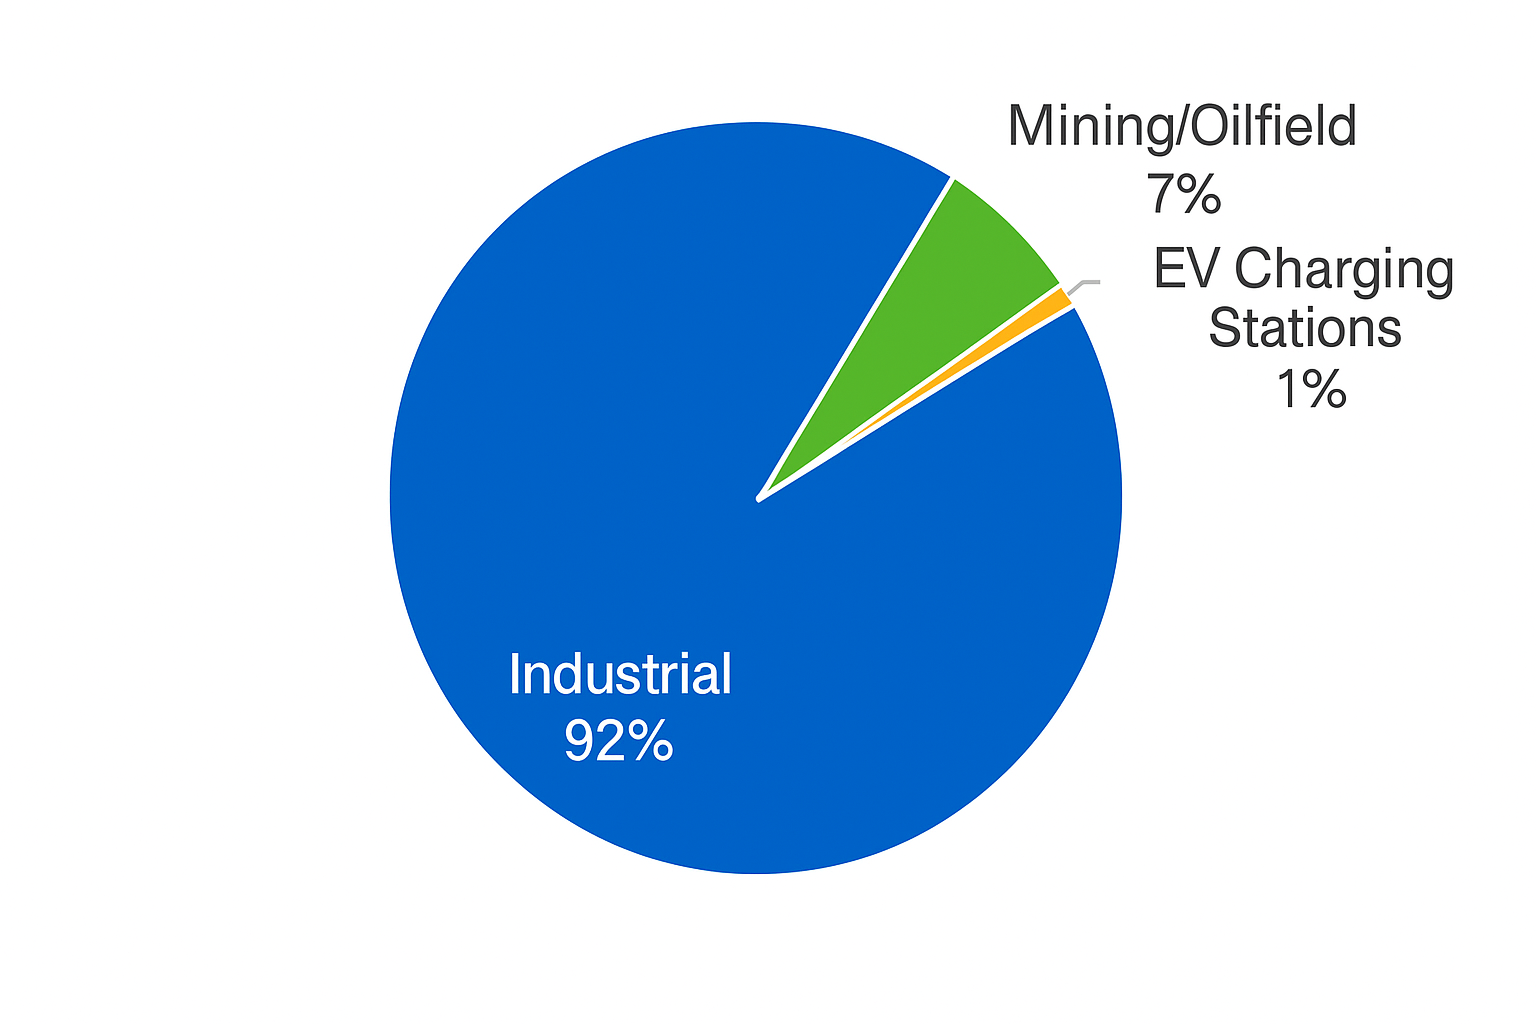
Figure 2 : Application Breakdown of Newly Commissioned User-side New-type Energy Storage Projects in October 2025 (MW%)
Data Source: CNESA DataLink Global Energy Storage Database
Website: https://www.esresearch.com.cn/
(2) Central China accounts for over 50% of new installations, with Henan leading in total capacity.
From a regional perspective, newly commissioned user-side projects in October were mainly distributed across 11 provinces, including Henan, Shandong, Guangdong, Jiangsu, and Jiangxi. Central China accounted for 50% of the newly added capacity, dominating the October installation market. East China recorded the largest number of newly commissioned projects, making up 38% of the national total. At the provincial level, Henan posted the largest new installed capacity, exceeding 40% of the national total, followed by Shandong. Guangdong ranked first nationwide in terms of the number of newly commissioned projects, contributing over 20%.
As a major industrial province, Henan has a strong presence of high-energy-consuming sectors such as steel, chemicals, and coal-fired power. The province also has a large electricity consumption base, with multiple energy-intensive industries—including steel and cement—facing increasing pressure related to renewable power consumption requirements. Driven by China’s push for green and low-carbon energy transition and industrial enterprises’ needs for carbon reduction, cost reduction, and supply security, user-side storage demand in Henan has expanded rapidly. At the same time, as a major agricultural province, Henan is tapping emerging application scenarios—especially in rural areas—under strong government support. The “green power + energy storage” model is accelerating demand growth in these new sectors, becoming an important new driver for user-side storage development in the province.
Moreover, Henan is one of the earliest provinces in China to advance integrated generation–grid–load–storage projects (source–grid–load–storage integration). As of October 2025, the province had released 14 batches of such projects, with over 650 projects included in the implementation scope. These projects span more than 10 application scenarios, including industrial facilities, rural areas, and data centers, providing broad opportunities for user-side C&I energy storage deployment.
In terms of energy storage revenue performance, following the adjustment of Henan’s C&I time-of-use electricity tariffs in 2024, the number of daily charge–discharge cycles decreased; however, the peak–valley price spread widened, and the duration of peak periods increased significantly—conditions that favor long-duration energy storage. Additionally, with strong demand for emergency support and peak shaving across various scenarios in Henan, C&I users aggregated through virtual power plants (VPPs) can participate in grid peak regulation and receive corresponding compensation.
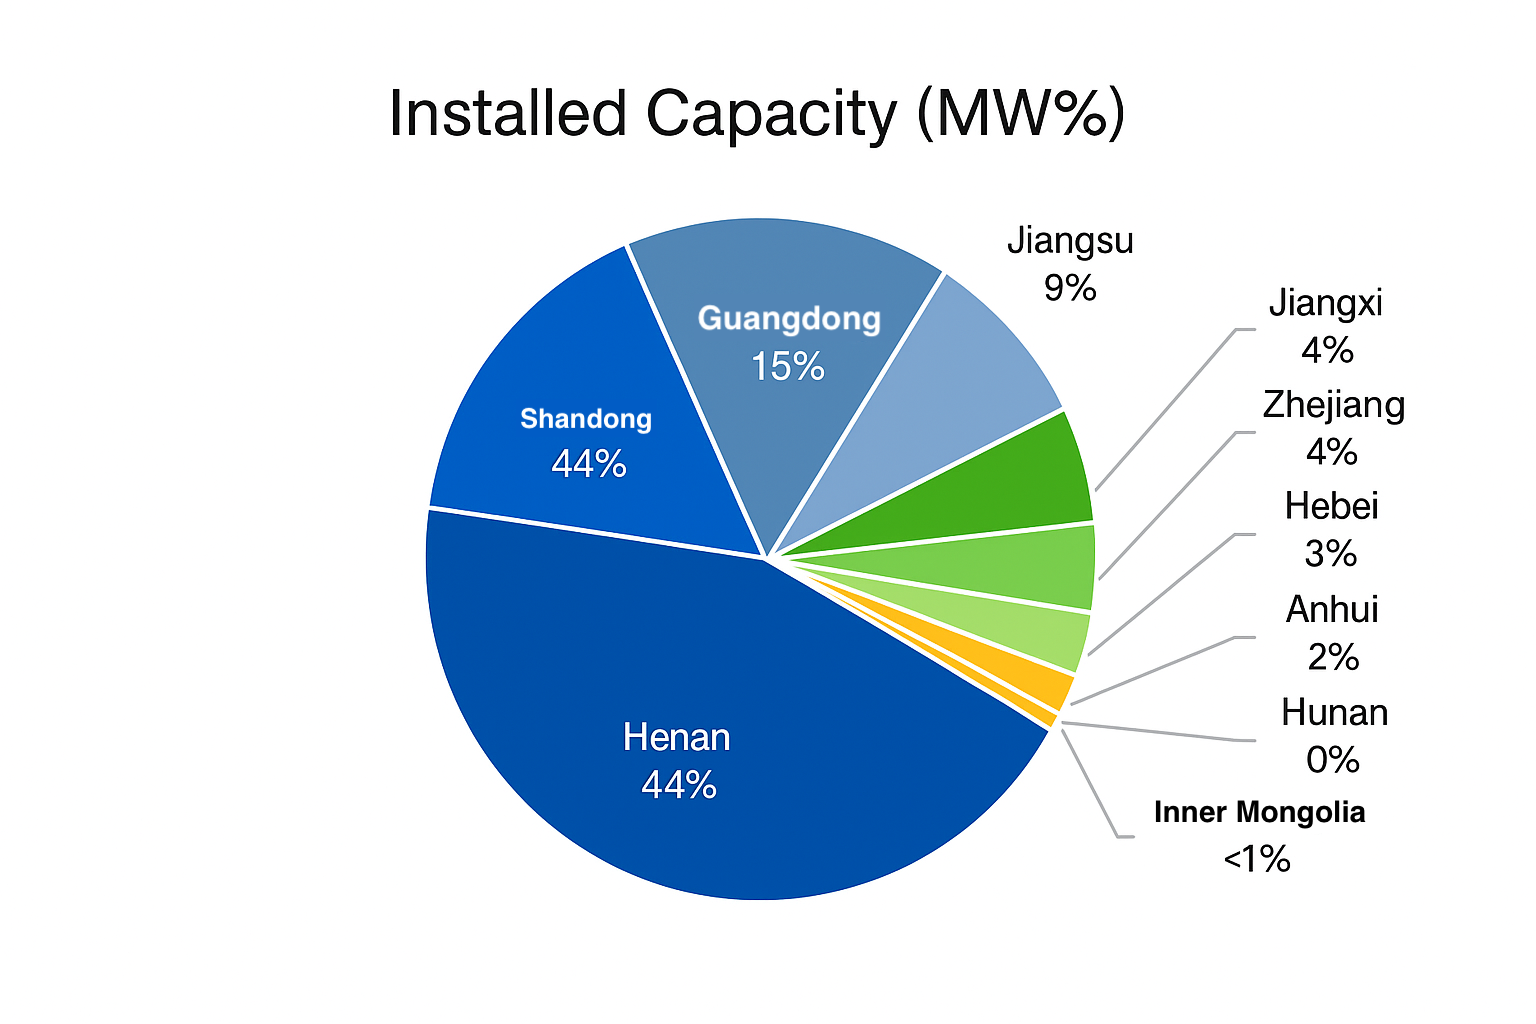

Figure 3&4: Provincial Distribution of Newly Commissioned User-side New-type Energy Storage Projects in China, October 2025
Data Source: CNESA DataLink Global Energy Storage Database
Website: https://www.esresearch.com.cn/
Based on project filings, national user-side market demand in October showed growth compared with the same period last year. Nationwide, both the scale and number of newly filed user-side projects in October exceeded last year’s levels, rising 91% and 4% year-on-year respectively. In traditional core markets, the number of newly filed projects in Zhejiang, Guangdong, and Jiangsu all fell compared with the same period last year. Together, the three provinces recorded 430 new filings, a 41% year-on-year decline, while total energy capacity increased by 37% year-on-year. In October, Guangdong had the highest number of newly filed projects nationwide, but still registered an 8% year-on-year decrease. Jiangsu recorded a 36% decline, while Zhejiang saw the steepest drop, down 64% year-on-year. From the perspective of project scale, Zhejiang’s newly filed energy capacity decreased 26% year-on-year, and Guangdong saw a 52% decline. Jiangsu, however, continued to lead the country in the scale of newly filed projects, with a 60% increase in energy capacity, reflecting a clear trend toward larger average project sizes. In October, Jiangsu’s market scale continued to expand, mainly driven by the rigid demand of C&I enterprises for energy storage to secure power supply and reduce operating costs. Nationwide, Anhui, Henan, and Sichuan collectively recorded 300 new filings, accounting for one-third of all newly filed user-side projects in October. These three provinces demonstrated strong market demand and significant growth potential for user-side energy storage, positioning them as emerging markets likely to drive national user-side storage expansion in the coming years.
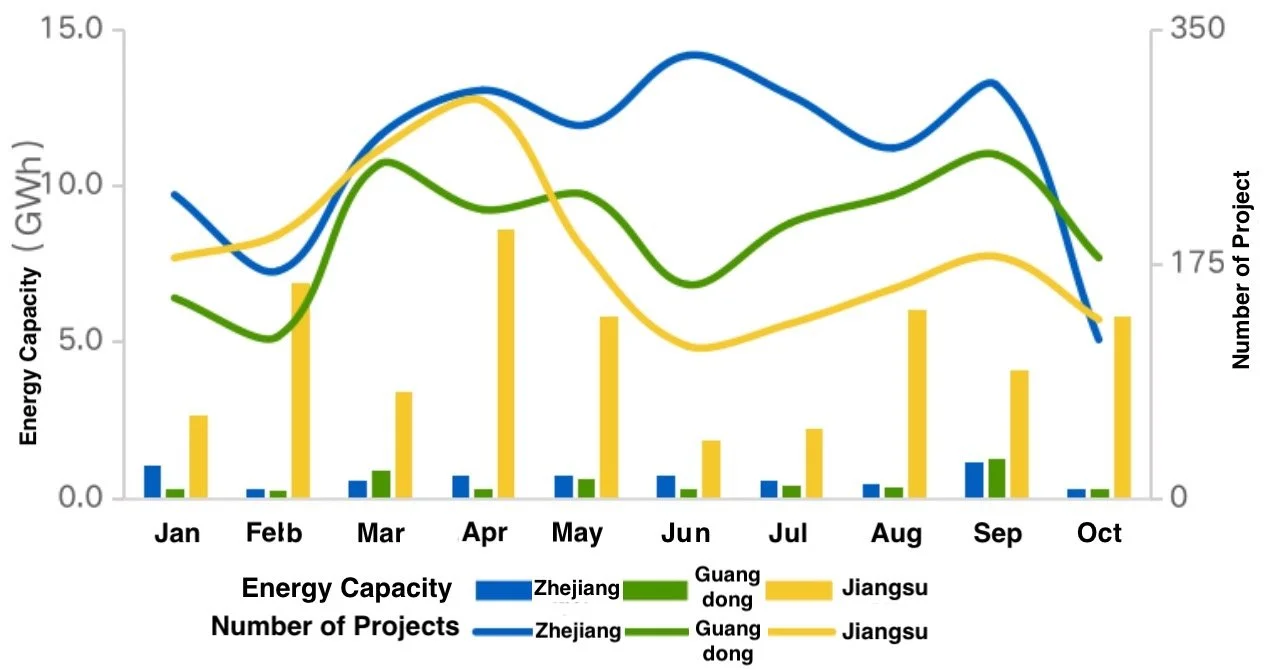
Figure 4 : Monthly Trend of Newly Filed Energy Storage Projects in Zhejiang, Guangdong, and Jiangsu (January–October 2025)
Data Source: CNESA DataLink Global Energy Storage Database
Website: https://www.esresearch.com.cn/
Based on the maximum peak–valley electricity price spread, 15 provinces and municipalities recorded spreads above 0.70 RMB/kWh, and 7 regions exceeded 1.0 RMB/kWh. Guangdong had the largest peak–valley price spread nationwide. In parts of the Greater Bay Area—including the five core cities of the Pearl River Delta, as well as Jiangmen and Huizhou—the maximum spread remained above 1.0 RMB/kWh, mainly due to the continued implementation of critical-peak pricing in the province. In October, many regions discontinued the critical-peak and deep-valley tariff mechanisms that were implemented during the summer peak period. Only five regions—Guangdong, Shandong, North Hebei (Jibei), South Hebei, and Hubei—continued to apply critical-peak pricing, while Shandong, Zhejiang, and Jiangxi maintained deep-valley tariffs. Considering both the maximum peak–valley price spread and the high achievable charge–discharge cycling frequency of user-side storage systems (which can exceed 600 cycles per year), the arbitrage potential in Guangdong remains substantial. Therefore, Guangdong is likely to remain one of the most important and active markets for user-side energy storage in the foreseeable future.
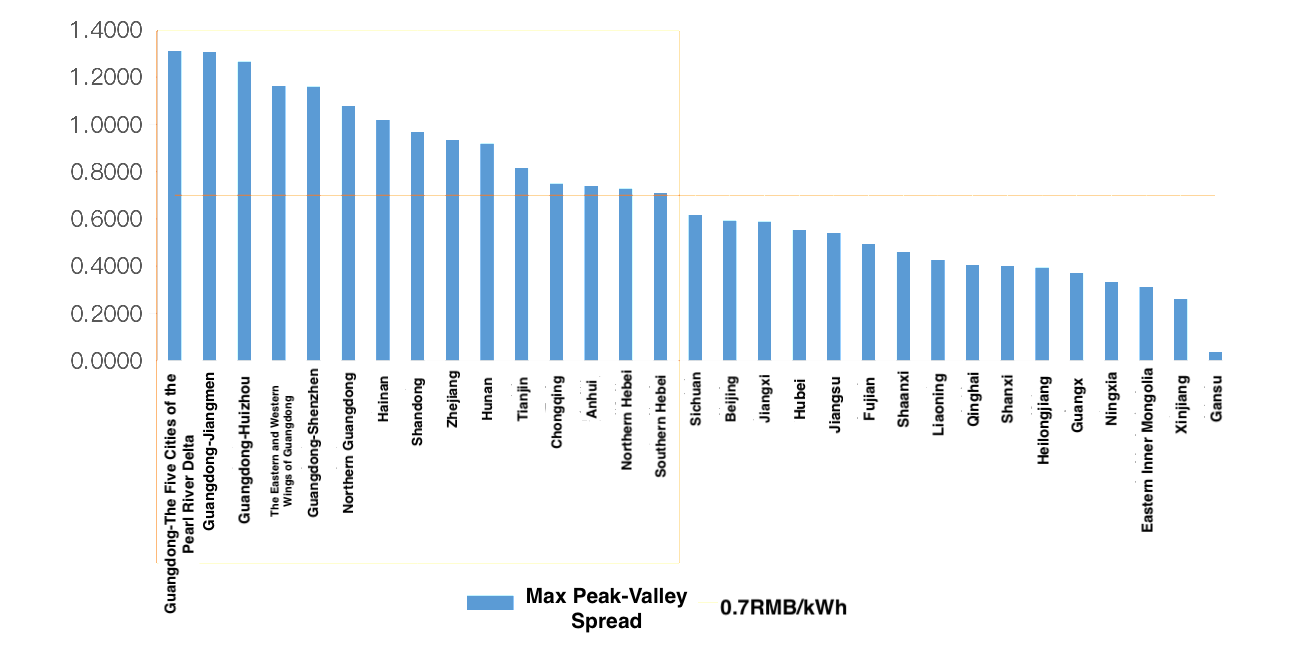
Figure 5: Distribution of Peak–Valley Electricity Price Spreads for Utility Power Purchases Across Regions, October 2025
Data Source: Provincial Grid Companies; compiled and analyzed by CNESA
CENSA Upcoming Events:
1.Dec.4-5 | 2025 China Energy Storage CEO Summit | Xiamen, Fujian
Register Now to attend
Read more: http://en.cnesa.org/new-events-1/2025/12/4/dec4-5-2025-china-energy-storage-ceo-summit

2.Apr. 1-3, 2026 | The 14th Energy Storage International Conference & Expo
Register Now to attend, free before Oct 31, 2025.


Down 35% Year-on-Year! CNESA Analysis of Installed Capacity of the New Grid&Source-Side Energy Storage Projects in October
Source: CNESA
After a small installation peak in September, China's new energy storage market saw a temporary decline in October 2025. According to incomplete statistics from the CNESA Datalink Global Energy Storage Database, both the month-on-month and year-on-year growth of newly commissioned capacity declined in October, mainly due to project cycle factors. Meanwhile, profound structural changes are taking place in the market:
● Short-term decline while long-term growth:
Although October's installed capacity declined, the cumulative capacity in the first ten months of 2025 still maintained a robust 36% growth, and 7-9 GW of projects are expected to come online before year-end, suggesting a record-breaking annual installation.
● Independent storage takes the lead:
In October, independent energy storage projects accounted for more than three-quarters of total installations, becoming the absolute main force.
● Third-party enterprises surpass state-owned giants:
A landmark shift occurred - “third-party enterprises”, represented by equipment manufacturers, accounted for over half of the newly installed capacity for the first time, surpassing traditional large energy groups and highlighting a clear trend toward diversified investment.
● Diverse technologies and accelerated non-lithium deployment:
In addition to mainstream lithium-ion systems, technologies such as compressed air, flow batteries, and flywheels are being accelerated in planning and construction, injecting new momentum into the industry's long-term development.
Overall Analysis of New Energy Storage Projects in October
According to incomplete statistics from the CNESA Datalink Global Energy Storage Database, in October 2025, China added 1.70 GW / 3.52 GWh of newly commissioned new energy storage capacity - down 35% and 49% YoY, and 51% and 66% MoM, respectively. Although the first month of Q4 saw a decrease, total new capacity from January to October reached 35.8 GW, up 36% YoY. Following the September commissioning surge, the October decline mainly reflected the influence of construction cycles.
As of the end of October, about 7-9 GW of new energy storage projects were under commissioning or scheduled for grid connection by year-end. If these projects proceed as planned, China's new commissioned capacity in 2025 could reach 42-45 GW. This estimate is based solely on currently known under-construction/commissioned project data and does not represent a final forecast.
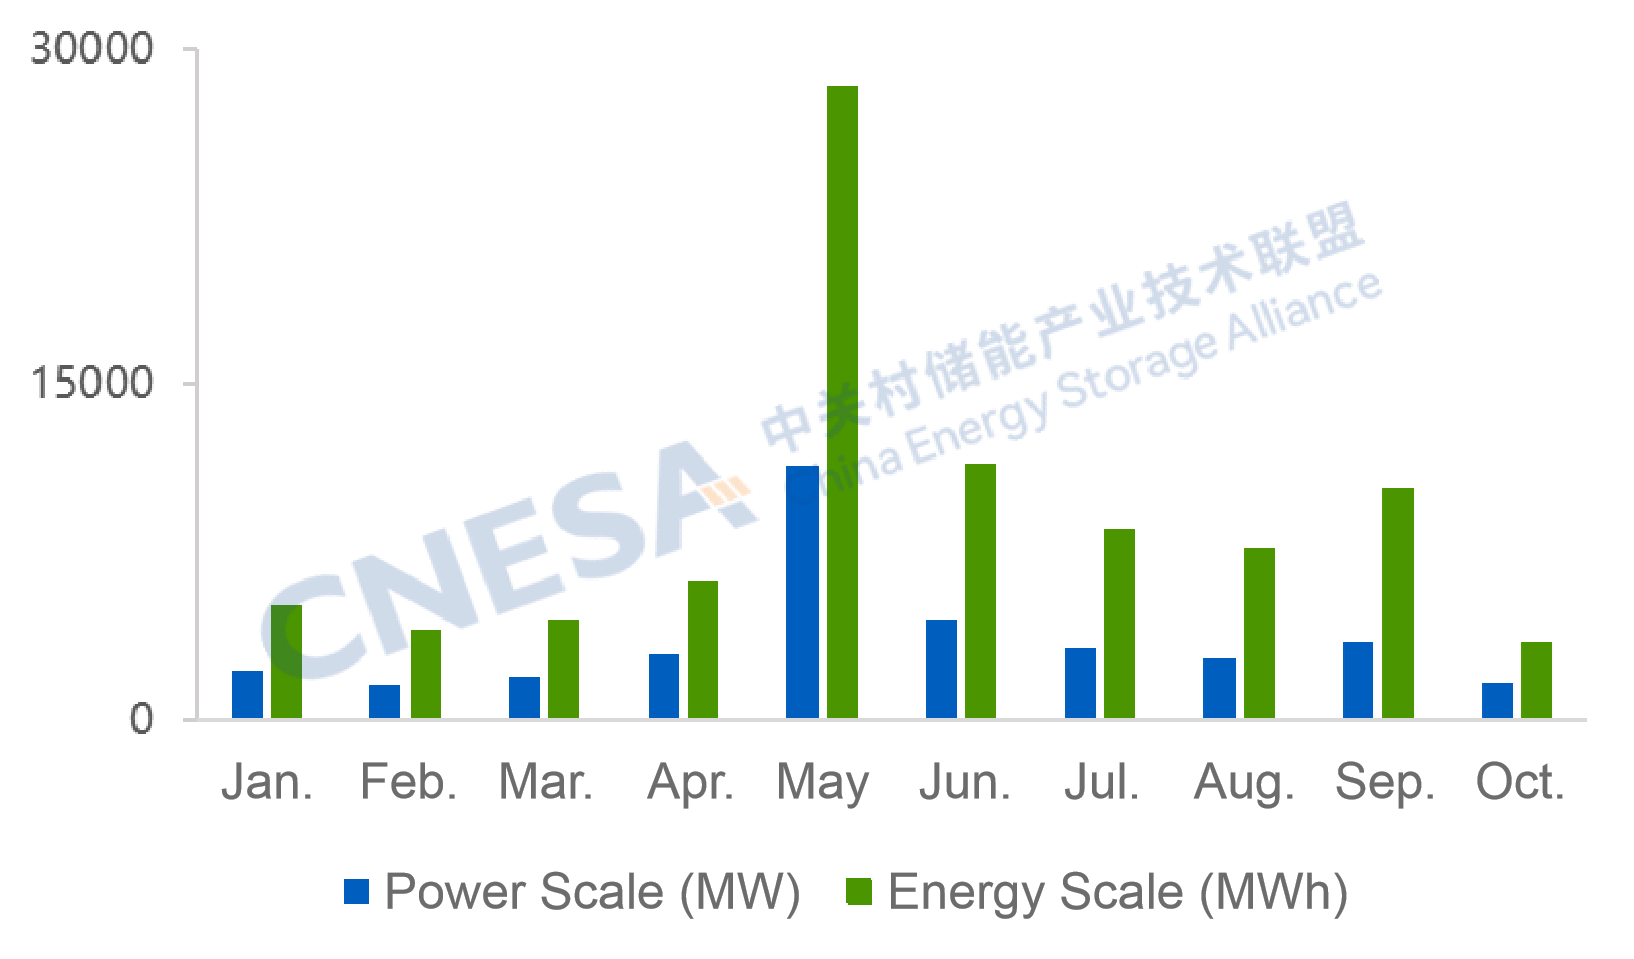
Figure 1. Installed Capacity of Newly Commissioned New Energy Storage Projects in China, Jan-Oct 2025
Source: CNESA Datalink Global Energy Storage Database
https://www.esresearch.com.cn/
Note: Year-on-year (YoY) compares the same period last year; month-on-month (MoM) compares the previous statistical period.
Analysis of Grid&Source-side New Energy Storage Projects in October
In October, newly commissioned grid&source-side new energy storage capacity totaled 1.51 GW / 3.04 GWh, representing year-on-year declines of 35% and 49%, and month-on-month declines of 53% and 69%.
Key trends included:
Independent storage accounts for over 75%, with capacity down 30% YoY
Independent energy storage added 1.18 GW / 2.31 GWh, down 30% and 48% YoY, with 78% of projects above 100 MW.
On the source side, new installations totaled 327.5 MW / 735 MWh, representing a YoY growth of -47%/-52%, all paired with renewable energy projects, involving various specific application scenarios including UHV DC transmission and solar-grazing hybrid application.
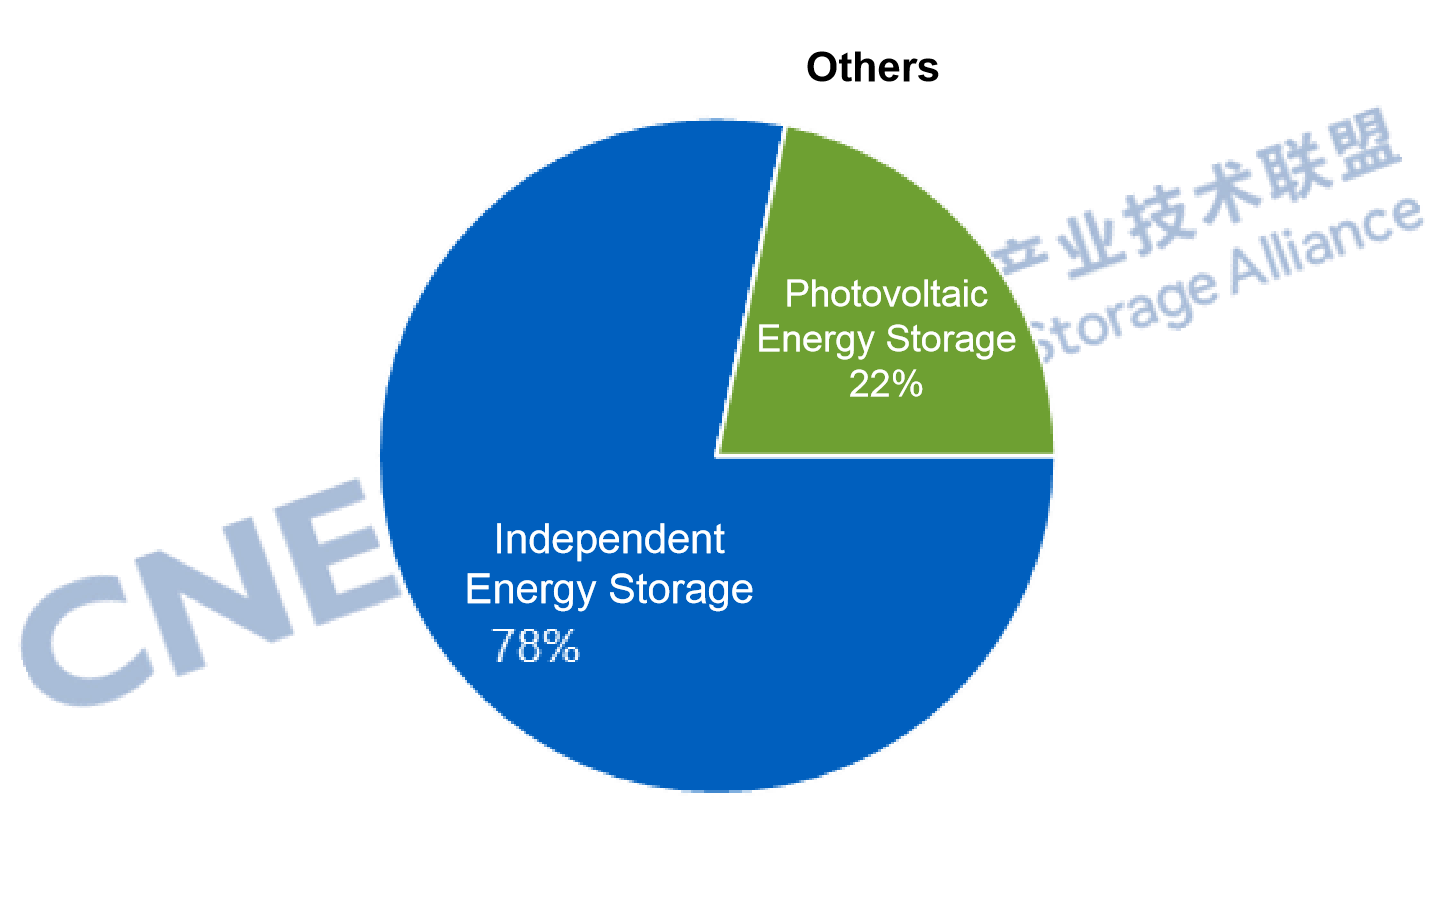
Figure 2. Application Distribution of Newly Commissioned Grid&Source-Side Energy Storage Projects in Oct. 2025 (MW%)
Source: CNESA Datalink Global Energy Storage Database
https://www.esresearch.com.cn/
Note: “Others” include substations and similar facilities.
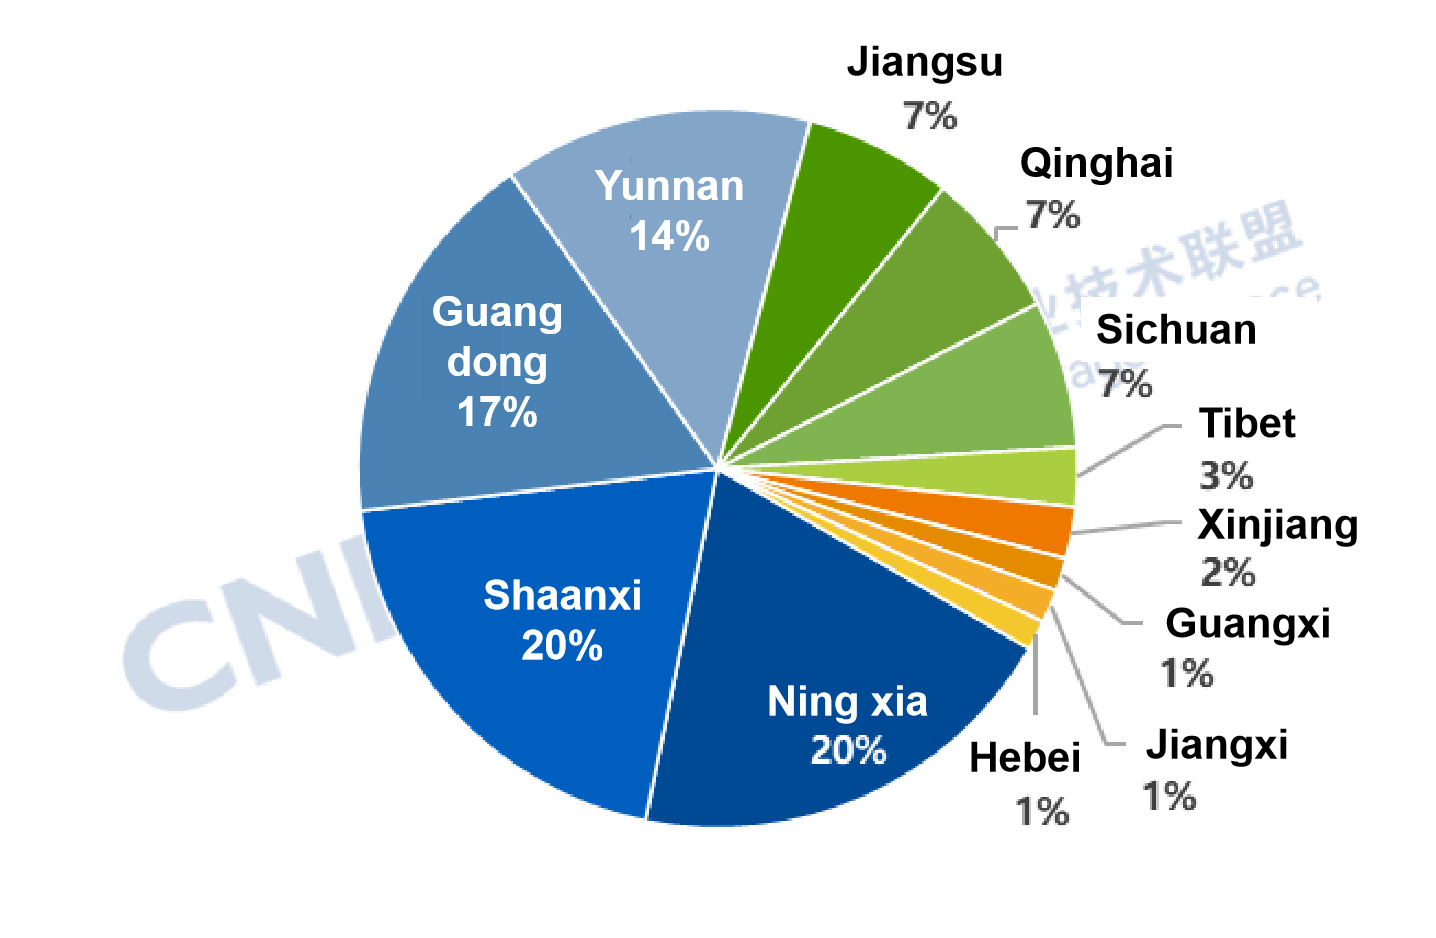
Western China accounts for over 50% of new installations; Ningxia and
Shanxi lead in scale
By region, western China contributed over half of October's new capacity, with the northwest region alone accounting for nearly 30%, the highest nationwide.
By province, Ningxia and Shanxi province ranked joint first in new power capacity, while Ningxia topped in new energy capacity.
As a key national new energy demonstration zone, Ningxia's renewable capacity had exceeded 50 GW by August 2025, representing 60% of total power installations - with solar surpassing coal to become the largest power source.
High proportions of wind and solar have created growing demand for storage to smooth grid fluctuations and enhance renewable integration. In addition, large-scale national initiatives such as the “Desert, Gobi and Wasteland” renewable base and UHV DC transmission projects have further expanded the application space for energy storage in Ningxia.

Figures 3. Regional Distribution of Newly Commissioned Grid&Source-Side New Energy Storage Projects in China, Oct. 2025 (MW%)
Source: CNESA Datalink Global Energy Storage Database
https://www.esresearch.com.cn/
Figures 4. Provincial Distribution of Newly Commissioned Grid&Source-Side New Energy Storage Projects in China, Oct. 2025 (MW%)
Source: CNESA Datalink Global Energy Storage Database
https://www.esresearch.com.cn/
Third-party enterprises drive growth, highlighting diversification of
investors
Driven by rising market demand, national policy incentives, technological diversification, and declining costs, the energy storage market's investment ecosystem is becoming increasingly diverse.
In October, projects invested by private power companies such as Fuguang New Energy and Yunsheng New Energy and energy storage/new energy manufacturers such as PotisEdge and Natrium Times (NTEL) accounted for over 50% of new installations - up 18 percentage points from September.
Nevertheless, large state-owned energy groups remain key players due to their advantages in project investment scale, construction coordination, and operational management.
In October, China's “Five Major and Six Minor” and “Two Grid and Two Engineering” state-owned power enterprises contributed 46% of newly installed capacity. Among them, “Five Major and Six Minor” and “Two Grid and Two Engineering” including CHN Energy, SPIC, and China Three Gorges Corporation accounted for 31%, down 10 percentage points from September, while the “Two Grid and Two Engineering” increased their share by 4 points.
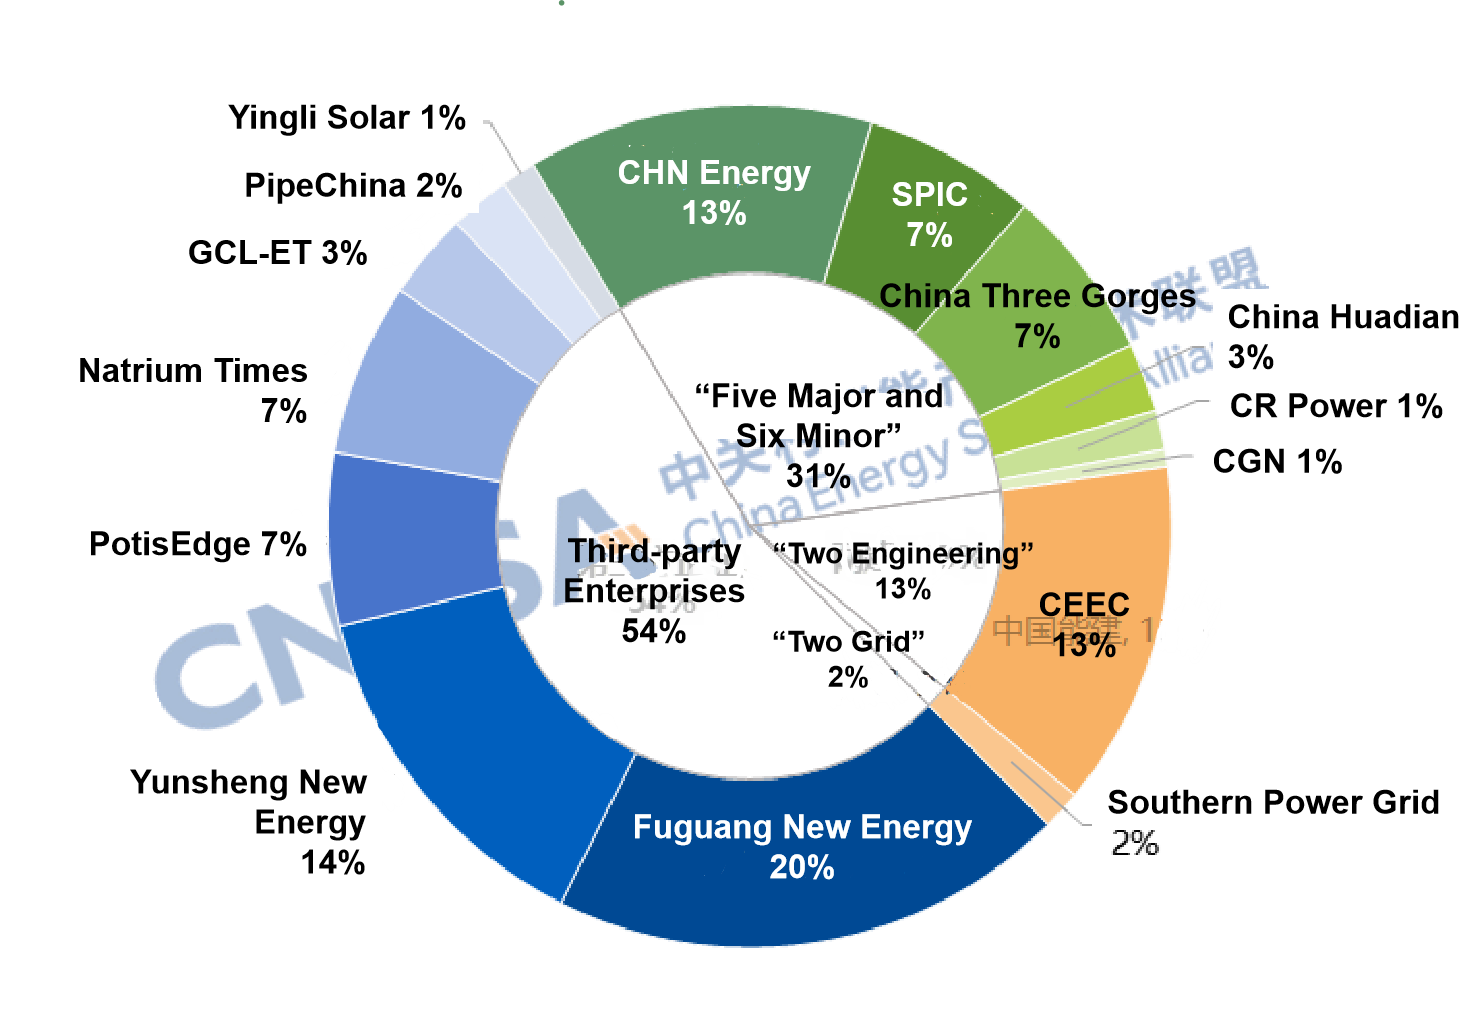
Figure 5. Ownership Distribution of Newly Commissioned Grid&Source-side New Energy Storage Project in China, Oct. 2025 (MW%)
Source: CNESA Datalink Global Energy Storage Database
https://www.esresearch.com.cn/
Note: “Third-party enterprises” refer to entities other than large state-owned generation groups, the two grid companies, two construction groups and local energy companies.
Acceleration in non-lithium technology deployment
From a technical perspective, newly commissioned grid&source-side projects were dominated by lithium iron phosphate batteries, accounting for 98.5% of capacity, with sodium-ion batteries representing 1.5%.
In terms of planned and under-construction projects, deployment of non-lithium technologies such as compressed air and hybrid storage is accelerating, signaling faster diversification of technology pathways.
Compressed air: Multiple 100 MW-level compressed air projects have completed filing and entered the planning stage; the 350 MW Anning (Yunnan) compressed air project has begun construction.
Hybrid storage: Hebei Province announced a pilot list including 97 hybrid projects totaling 13.82 GW; construction of two 100 MW lithium + flow battery projects began in Weifang, Shandong; the 100 MW flywheel-lithium hybrid station is under construction in Heishan, Liaoning; the 300 MW / 1200 MWh independent power-side storage project using lithium + flow battery hybrid technology has entered the grid-commissioning stage at Gushanliang, Ordos, Inner Mongolia.

Figure 6: Technological Distribution of Newly Commissioned Grid&Source-Side New Energy Storage Projects in China, Oct. 2025 (MW%)
Source: CNESA Datalink Global Energy Storage Database
https://www.esresearch.com.cn/
The China Energy Storage Alliance (CNESA) has consistently adhered to standardized, timely, and comprehensive information collection practices to continuously track developments in energy storage projects. Leveraging its long-term data accumulation and in-depth professional analysis, CNESA regularly publishes objective market analyses on installed energy storage capacity, providing valuable references for industry decision-making. Since June 2025, the monthly energy storage project analysis has been divided into two sections: “Grid&Source-Side Market” and “User-Side Market”. This issue focuses on interpreting the grid&source-side market in October.
CENSA Upcoming Events:
1. Dec.4-5 | 2025 China Energy Storage CEO Summit | Xiamen, Fujian
Register Now to attend
Read more: http://en.cnesa.org/new-events-1/2025/12/4/dec4-5-2025-china-energy-storage-ceo-summit

2. Apr. 1-3, 2026 | The 14th Energy Storage International Conference & Expo
Register Now to attend, free before Oct 31, 2025.

Sign up for our free monthly newsletter to stay informed about the Chinese energy storage market.